The Top Forex Trading Strategies for 2025? Forget crystal balls; we’re diving deep into the nitty-gritty of conquering the forex market next year. From riding the trends like a pro to mastering the art of mean reversion, we’re spilling the tea on strategies that could seriously boost your trading game. Get ready to level up your financial future – because 2025 is calling.
This guide breaks down the hottest forex trading strategies predicted to dominate in 2025. We’ll explore trend following, mean reversion, scalping, swing trading, and algorithmic approaches, all while emphasizing the crucial role of risk management and the impact of geopolitical shifts and technological advancements. We’ll even show you how to interpret key indicators and chart patterns – no prior experience necessary (but a thirst for knowledge definitely helps!).
Introduction to Forex Trading in 2025
The forex market, already a behemoth, is poised for even more dramatic changes in 2025. Increased automation, evolving geopolitical landscapes, and shifting regulatory frameworks will significantly impact trading strategies and require adaptability from even the most seasoned traders. Understanding these shifts is crucial for navigating the opportunities and challenges that lie ahead.
The forex market in 2025 will be characterized by heightened volatility driven by a confluence of factors. Geopolitical instability, particularly concerning major global economies, will continue to be a primary driver of currency fluctuations. The ongoing energy transition, coupled with potential supply chain disruptions, will exert pressure on various currencies. Technological advancements, such as the increased use of artificial intelligence in algorithmic trading, will further amplify market dynamism, creating both opportunities and risks. Finally, regulatory changes, aimed at increasing transparency and mitigating risks, will impact trading practices and necessitate compliance.
Key Factors Influencing Forex Trading Strategies in 2025
Geopolitical events, technological advancements, and regulatory changes will significantly shape forex trading strategies in the coming years. The ongoing war in Ukraine, for example, has already demonstrably impacted the Euro and Ruble, highlighting the unpredictable nature of geopolitical risk. The rise of AI-powered trading algorithms is changing the speed and efficiency of market reactions, demanding a more sophisticated understanding of market dynamics. Meanwhile, increased regulatory scrutiny, particularly regarding anti-money laundering (AML) and know-your-customer (KYC) compliance, is reshaping trading practices. Traders will need to adapt to these changes to remain competitive and compliant.
Types of Forex Trading Strategies
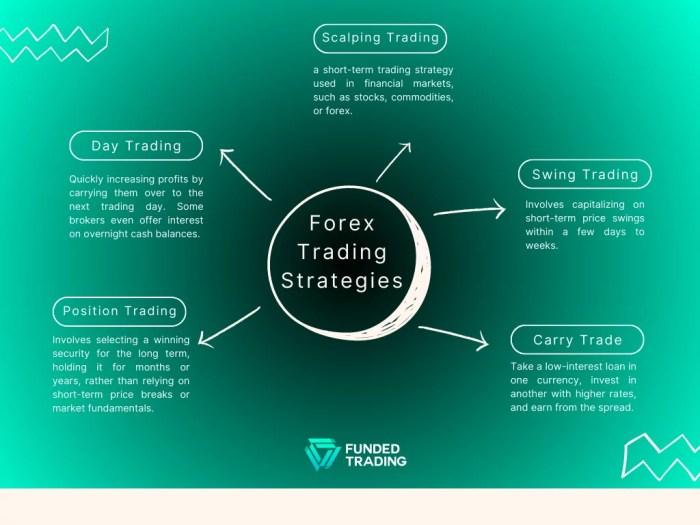
Forex trading strategies broadly fall into several categories, each with its own risk profile and potential rewards. Scalping, for example, involves profiting from small price movements over short periods, requiring rapid execution and close market monitoring. Day trading focuses on holding positions for a single trading day, capitalizing on intraday price fluctuations. Swing trading holds positions for several days or weeks, aiming to capture larger price swings. Position trading involves holding positions for extended periods, often months or even years, focusing on long-term market trends. Each strategy requires a different approach, risk management plan, and level of market analysis. For instance, a scalper might rely heavily on technical indicators, while a position trader may focus more on fundamental analysis and macroeconomic trends. Choosing the right strategy depends heavily on individual risk tolerance, trading experience, and available time commitment.
Trend Following Strategies
Trend following, a cornerstone of forex trading, capitalizes on the momentum of price movements. Successful traders using this approach ride the wave of established trends, aiming to profit from sustained price direction rather than attempting to predict market tops and bottoms. This strategy thrives in trending markets but can be less effective during periods of sideways consolidation.
Trend following strategies rely on technical indicators to identify and confirm trends. These indicators help traders to objectively assess market direction and minimize emotional decision-making. While various indicators exist, the moving average crossover is a particularly popular and straightforward method.
Moving Average Crossover Strategy
The moving average crossover strategy utilizes two moving averages of different lengths—a shorter-term and a longer-term average—to generate buy and sell signals. When the shorter-term moving average crosses above the longer-term moving average, it’s considered a bullish signal (buy). Conversely, a bearish signal (sell) is generated when the shorter-term average crosses below the longer-term average.
Let’s illustrate with a hypothetical scenario using a 5-period and a 20-period simple moving average for the EUR/USD pair.
Expand your understanding about The Role of News in Forex Trading with the sources we offer.
| Date | EUR/USD Price | 5-Period MA | 20-Period MA | Signal |
|---|---|---|---|---|
| Oct 26 | 1.0650 | 1.0640 | 1.0620 | – |
| Oct 27 | 1.0660 | 1.0645 | 1.0625 | – |
| Oct 28 | 1.0680 | 1.0655 | 1.0630 | – |
| Oct 29 | 1.0700 | 1.0670 | 1.0635 | Buy |
| Oct 30 | 1.0720 | 1.0685 | 1.0640 | – |
| Oct 31 | 1.0750 | 1.0700 | 1.0645 | – |
| Nov 1 | 1.0730 | 1.0705 | 1.0650 | – |
| Nov 2 | 1.0700 | 1.0700 | 1.0655 | Sell |
In this example, a buy signal is generated on October 29th when the 5-period MA crosses above the 20-period MA. A sell signal is generated on November 2nd when the 5-period MA crosses below the 20-period MA. Note that this is a simplified example and doesn’t incorporate other factors like risk management.
Notice The Importance of Risk Management in Forex Trading for recommendations and other broad suggestions.
MACD and RSI Comparison
Choosing the right indicator is crucial for trend following. The Moving Average Convergence Divergence (MACD) and the Relative Strength Index (RSI) are two popular choices, each with its strengths and weaknesses.
Here’s a comparison of these two indicators:
- MACD: Analyzes momentum by comparing two exponential moving averages. Generates signals based on crossovers of the MACD line and signal line, and also uses histograms to indicate momentum strength. More sensitive to short-term price fluctuations.
- RSI: Measures the magnitude of recent price changes to evaluate overbought or oversold conditions. Signals are generated based on RSI levels exceeding overbought (typically 70) or oversold (typically 30) thresholds. Less sensitive to short-term noise but can generate false signals in ranging markets.
Risk Management in Trend Following
Effective risk management is paramount in trend following strategies, as prolonged periods of sideways movement or trend reversals can lead to significant losses.
Key risk management techniques include:
- Stop-Loss Orders: Essential to limit potential losses. These orders automatically close a position when the price reaches a predetermined level.
- Position Sizing: Carefully determining the appropriate amount to invest in each trade, based on risk tolerance and account size. Never risk more than a small percentage (e.g., 1-2%) of your account capital on a single trade.
- Trailing Stop-Losses: These dynamically adjust the stop-loss order as the price moves in your favor, locking in profits and reducing the risk of large losses during a trend reversal.
- Diversification: Spreading investments across multiple currency pairs or asset classes to reduce overall portfolio risk.
Mean Reversion Strategies

Mean reversion, a cornerstone of many successful forex trading strategies, hinges on the belief that prices, after significant deviations, tend to revert back to their average. This strategy isn’t about predicting long-term trends; it’s about capitalizing on temporary price swings. Successful implementation requires careful indicator selection and risk management, as we’ll explore below.
Mean reversion strategies identify and profit from price corrections by exploiting the cyclical nature of market movements. Instead of following trends, traders using this approach anticipate price reversals at overbought or oversold levels. They look for opportunities to buy when prices fall below a perceived mean and sell when prices rise above it, profiting from the expected return to the average. This approach can be particularly effective in ranging markets, where prices fluctuate within a defined band.
Mean Reversion Indicators and Their Application
Several technical indicators help identify potential mean reversion setups. Understanding how these indicators work and their limitations is crucial for effective trading.
Bollinger Bands, for instance, plot standard deviations around a moving average. When prices touch the upper band, it suggests an overbought condition and a potential sell signal; conversely, prices touching the lower band indicate an oversold condition and a potential buy signal. The width of the bands also provides insights into market volatility; wider bands suggest higher volatility and potentially stronger mean reversion opportunities. A visual representation would show a moving average line with two bands, one above and one below, representing standard deviations. The closer the price gets to the upper band, the more overbought it is, and vice versa.
The Stochastic Oscillator is another popular tool. It compares a security’s closing price to its price range over a given period. Readings above 80 generally indicate an overbought condition, while readings below 20 suggest an oversold condition. Crossovers of the %K and %D lines can also generate buy or sell signals. A chart would display two lines, %K and %D, fluctuating between 0 and 100. A crossover above 80 would signal potential selling opportunities and a crossover below 20 potential buying opportunities.
Limitations of Mean Reversion Strategies
While mean reversion strategies can be profitable, they’re not foolproof. One significant limitation is the assumption that prices will always revert to the mean. In strong trending markets, prices can deviate significantly from the average for extended periods, leading to substantial losses for traders relying on mean reversion. For example, during a prolonged period of economic uncertainty, a currency pair might experience a sustained downtrend, defying typical mean reversion patterns.
Another limitation is the difficulty in accurately determining the “mean.” Different methods for calculating the average, such as using different moving averages or periods, can yield different results. This subjectivity can impact the effectiveness of the strategy. Furthermore, the choice of indicator and its parameters significantly influences the trading signals generated. Incorrectly choosing or setting parameters can lead to false signals and losses.
Scalping Strategies
Scalping, in the fast-paced world of forex trading, is all about snatching small profits from numerous, quick trades. It’s a high-frequency strategy demanding intense focus, rapid decision-making, and a deep understanding of short-term market fluctuations. Unlike long-term strategies, scalpers aim for tiny gains on each trade, relying on volume to accumulate substantial profits. This high-risk, high-reward approach isn’t for the faint of heart.
Scalping relies on identifying and exploiting minuscule price movements that occur within seconds or minutes. These movements are often driven by temporary imbalances in supply and demand, news events, or algorithm-driven trading. Successfully identifying these fleeting opportunities requires keen observation of price action, technical indicators, and a robust trading plan.
Identifying Short-Term Price Movements
Recognizing short-term price movements is the cornerstone of successful scalping. This involves meticulously observing candlestick patterns on very short timeframes, typically 1-minute, 5-minute, or 15-minute charts. Look for candlestick patterns that signal a potential shift in momentum, such as engulfing patterns, pin bars, or inside bars. These patterns, when combined with other technical indicators, can provide strong signals for entry and exit points. Furthermore, observing volume alongside these patterns can confirm the strength of the price movement. High volume accompanying a candlestick pattern suggests a stronger signal.
Technical Indicators and Chart Patterns Used in Scalping
Several technical indicators and chart patterns are commonly employed by scalpers to enhance their decision-making process. Moving averages, particularly fast-moving averages like the 5-period or 10-period exponential moving averages (EMAs), can help identify the immediate trend. Relative Strength Index (RSI) helps gauge the strength of the price movement and spot potential overbought or oversold conditions, signaling potential reversal points. Stochastic oscillators, another momentum indicator, can also be utilized to pinpoint entry and exit points. Common chart patterns, as mentioned earlier, like pin bars and engulfing patterns, provide visual cues of potential price reversals or continuations.
Executing a Scalping Trade: A Step-by-Step Guide
A well-defined process is crucial for successful scalping. The following steps Artikel a typical approach:
- Identify a potential trade setup: This involves observing price action on a short timeframe chart, looking for candlestick patterns and confirming them with technical indicators such as EMAs or RSI. For instance, a bullish engulfing pattern coupled with an RSI reading below 30 could signal a potential long trade.
- Place a limit order: Instead of market orders, limit orders are preferred to control entry price and avoid slippage. A limit order allows you to enter the trade only when the price reaches a specific level.
- Set a tight stop-loss order: This is crucial to limit potential losses. The stop-loss order should be placed just below the entry price for a long position and above for a short position, usually within a few pips.
- Determine a take-profit level: This is the price at which you will close your trade and secure your profit. The take-profit level should be based on your risk tolerance and the expected price movement. A risk-reward ratio of 1:1 or 1:2 is often used.
- Monitor the trade closely: Scalping requires constant monitoring. Be prepared to adjust your stop-loss or take-profit levels if necessary, based on changing market conditions.
- Close the trade: Once your take-profit or stop-loss is hit, or if the trade is not going as planned, close the position to lock in your profit or limit your loss.
Swing Trading Strategies
Swing trading offers a middle ground between the frenetic pace of day trading and the long-term horizons of investing. It involves holding positions for a few days to a few weeks, capitalizing on intermediate-term price swings. This approach allows traders to capture significant price movements while mitigating some of the risks associated with shorter-term strategies.
Swing trading differs from day trading in its holding period. Day traders typically close all positions before the market closes, while swing traders hold their positions for several days or even weeks. In contrast to long-term investing, which focuses on holding assets for months or years, swing trading aims for quicker returns by exploiting shorter-term price fluctuations.
Swing Trading Opportunity Selection
Identifying promising swing trading opportunities requires a keen eye for chart patterns and a solid understanding of technical indicators. Traders should look for assets exhibiting clear trends or showing signs of significant price reversals. Fundamental analysis can also play a role, especially when considering economic events or company news that might impact price movements. Risk management is crucial; traders should define stop-loss orders to limit potential losses and carefully manage position sizing to avoid overexposure.
Swing Trading Setups Using Chart Patterns and Technical Indicators
Several chart patterns and technical indicators can signal potential swing trading opportunities. For instance, a head and shoulders pattern often precedes a price decline, while a double bottom might indicate a bullish reversal. Indicators like the Relative Strength Index (RSI) and Moving Average Convergence Divergence (MACD) can help confirm these patterns and identify potential entry and exit points.
| Setup | Chart Pattern | Technical Indicator | Hypothetical Example |
|---|---|---|---|
| Bullish Reversal | Double Bottom | RSI crossing above 30 | Stock XYZ falls to $50, bounces, then retests $50 before rising to $60. RSI confirms the bounce. |
| Bearish Reversal | Head and Shoulders | MACD bearish crossover | Stock ABC reaches a high of $100, forms a head and shoulders pattern, then breaks below the neckline, dropping to $80. MACD confirms the bearish trend. |
| Uptrend Continuation | Flag Pattern | 20-day moving average support | Currency pair EUR/USD is in an uptrend, forms a flag pattern, and continues its upward trajectory after breaking above the flag’s upper trendline, remaining above the 20-day moving average. |
| Downtrend Continuation | Pennant Pattern | 50-day moving average resistance | Commodity X is in a downtrend, forms a pennant pattern, and continues its downward movement after breaking below the pennant’s lower trendline, staying below the 50-day moving average. |
Algorithmic Trading Strategies
Algorithmic trading, or algo-trading, is rapidly transforming the forex market. It leverages sophisticated computer programs to execute trades based on pre-defined rules and algorithms, removing emotional biases and allowing for incredibly fast execution speeds. This section delves into the role of algorithms in automated forex trading, exploring its advantages, disadvantages, and showcasing examples of various strategies.
Algorithms in automated forex trading act as the brains of the operation. They analyze vast quantities of market data – price movements, economic indicators, news sentiment – far exceeding human capacity. Based on this analysis, they identify potential trading opportunities and execute trades autonomously, following pre-programmed instructions. This allows for consistent execution of strategies, even during volatile market conditions, and eliminates the emotional decision-making that can often lead to poor trading outcomes.
Advantages and Disadvantages of Algorithmic Trading
Algorithmic trading offers significant advantages, but it’s not without its drawbacks. A balanced perspective is crucial before implementing such strategies.
- Speed and Efficiency: Algorithms execute trades at lightning speed, capitalizing on fleeting market opportunities unavailable to manual traders. This speed advantage is especially crucial in high-frequency trading.
- Reduced Emotional Bias: Unlike human traders, algorithms are not susceptible to fear, greed, or emotional impulses. They execute trades based solely on pre-programmed rules, leading to more rational and disciplined trading.
- Backtesting Capabilities: Algorithms can be thoroughly backtested using historical data to assess their potential profitability and risk profile before deploying them in live trading environments. This helps refine strategies and minimize potential losses.
- Increased Discipline and Consistency: Algorithms follow trading rules precisely and consistently, avoiding impulsive decisions that can lead to losses. This ensures a disciplined approach to trading regardless of market conditions.
- High Initial Investment: Developing and implementing sophisticated algorithmic trading systems requires significant upfront investment in software, hardware, and expertise.
- Complexity and Technical Expertise: Designing and maintaining effective algorithms requires advanced programming skills and a deep understanding of financial markets. This expertise is not easily accessible to everyone.
- Risk of System Errors: Bugs or flaws in the algorithm can lead to significant financial losses. Robust testing and ongoing monitoring are crucial to mitigate this risk.
- Dependence on Data Quality: The accuracy and reliability of the algorithms depend heavily on the quality of the market data used. Inaccurate or incomplete data can lead to poor trading decisions.
Examples of Algorithmic Trading Strategies
Several distinct algorithmic trading strategies exist, each designed to exploit specific market dynamics.
- Arbitrage: This strategy exploits price discrepancies between different markets or exchanges. For example, an algorithm might simultaneously buy a currency pair on one exchange and sell it on another, profiting from the small price difference. The profit margin is typically small, but the high volume of trades can generate substantial returns.
- High-Frequency Trading (HFT): HFT involves executing a large number of trades at extremely high speeds, often exploiting tiny price fluctuations. These algorithms rely on sophisticated technology and infrastructure to achieve microsecond-level execution speeds. While potentially highly profitable, HFT is also extremely risky and requires significant capital and technical expertise.
- Mean Reversion Strategies: These algorithms identify assets that have deviated significantly from their historical average price and predict a return to the mean. They automatically buy when prices are low and sell when they are high, aiming to profit from price corrections.
- Trend Following Strategies: These algorithms identify and capitalize on established market trends. They use technical indicators and other signals to identify trends and execute trades accordingly, aiming to profit from sustained price movements in a particular direction. Examples include moving average crossovers and RSI-based strategies implemented algorithmically.
Risk Management and Money Management
Forex trading, while potentially lucrative, is inherently risky. Ignoring risk management is akin to sailing a ship without a compass – you might get lucky, but you’re far more likely to crash. Successful forex traders aren’t just skilled at predicting market movements; they’re masters of controlling their losses and protecting their capital. This section delves into the crucial strategies that form the bedrock of any successful forex trading plan.
Risk management isn’t about avoiding losses entirely; it’s about minimizing them and maximizing your chances of long-term profitability. It’s a proactive approach that involves setting clear rules and sticking to them, regardless of market conditions or emotional impulses. A well-defined risk management plan allows you to trade confidently, knowing that you’ve taken steps to protect your hard-earned money. It’s the difference between a thrilling gamble and a well-calculated investment.
Stop-Loss Orders
Stop-loss orders are your safety net. They’re automated instructions to your broker to sell a currency pair when it reaches a predetermined price, limiting your potential losses. For example, if you buy EUR/USD at 1.1000 and set a stop-loss at 1.0950, your position will be automatically closed if the price drops to that level, preventing further losses. The key is to set your stop-loss strategically, considering factors like volatility and your risk tolerance. Setting it too tight might lead to frequent stop-outs, while setting it too loose could expose you to significant losses. The ideal stop-loss level is often determined by technical analysis or support levels.
Position Sizing
Position sizing determines how much capital you allocate to each trade. It’s about balancing risk and reward. A common approach is to risk only a small percentage of your total trading capital on any single trade, typically between 1% and 5%. This ensures that even if several trades lose, your overall account balance remains relatively healthy. For instance, with a $10,000 account and a 2% risk tolerance, you wouldn’t risk more than $200 on any given trade. This approach helps to manage risk effectively and prevent catastrophic losses. Calculating your position size requires considering your stop-loss level and the lot size you intend to trade.
Diversification
Diversification is the practice of spreading your investments across different currency pairs or asset classes. It’s not about putting all your eggs in one basket. By diversifying your portfolio, you reduce your overall risk. If one currency pair performs poorly, the losses might be offset by gains in another. This doesn’t eliminate risk entirely, but it significantly mitigates the impact of negative market events. A diversified portfolio might include major currency pairs like EUR/USD and GBP/USD, as well as emerging market pairs or even other asset classes like gold or stocks, depending on your strategy and risk appetite. Consider this: imagine relying solely on the EUR/USD. A sudden Eurozone crisis could wipe out your portfolio. Diversification reduces this type of single-point-of-failure risk.
Hypothetical Trading Plan with Risk Management
Let’s envision a trading plan for a hypothetical trader, Alex, with a $5,000 account. Alex decides to risk only 1% of their capital per trade, meaning a maximum loss of $50 per trade. They’ve identified two currency pairs they want to trade: EUR/USD and GBP/USD. Alex will use technical analysis to identify entry and exit points for each trade, always placing a stop-loss order to limit potential losses to $50. They will also diversify their trades, avoiding putting all their capital into one pair. For example, they might allocate $25 to one EUR/USD trade and $25 to a GBP/USD trade. This ensures that even if one trade loses, the other could potentially offset the loss. Furthermore, Alex will maintain a detailed trading journal to track their performance and identify areas for improvement in their risk management strategy. Regular review and adjustment of this plan are key to long-term success.
The Impact of Geopolitical Events
Geopolitical events, often unpredictable and far-reaching, significantly influence the forex market. These events introduce uncertainty, prompting traders to reassess risk and adjust their positions, leading to substantial currency fluctuations. Understanding how these events impact currency pairs is crucial for successful forex trading in 2025 and beyond.
Geopolitical events create volatility by altering investor sentiment and market expectations. Major shifts in global power dynamics, international relations, and economic policies directly impact currency valuations. This volatility presents both opportunities and risks for traders, requiring careful analysis and strategic planning.
Identifying and Assessing Geopolitical Impact on Currency Pairs
Analyzing the potential impact of geopolitical events requires a multi-faceted approach. Traders need to consider the specific event, the countries involved, and the overall global economic climate. For example, a political crisis in a major oil-producing nation might strengthen the US dollar, considered a safe haven asset, while weakening the currency of the affected nation. Conversely, a positive economic development in a particular region could boost its currency’s value relative to others. News sources, economic forecasts, and political analysis reports provide essential information for this assessment.
Examples of Historical Events and Their Effects
The 2014 annexation of Crimea by Russia significantly impacted the ruble, causing a sharp devaluation. The resulting sanctions imposed on Russia further contributed to its currency’s weakness. Conversely, the election of Donald Trump in 2016 initially led to a strengthening of the US dollar due to expectations of increased fiscal spending and deregulation. The 9/11 terrorist attacks caused a temporary flight to safety, pushing the US dollar higher and other currencies lower. These examples highlight how unexpected geopolitical events can drastically alter forex market dynamics, sometimes in counterintuitive ways. Careful consideration of these past events and their impacts can help inform trading strategies in the face of future uncertainty.
Technological Advancements and Forex Trading
The forex market, already a whirlwind of complex financial interactions, is undergoing a dramatic transformation thanks to rapid technological advancements. Artificial intelligence (AI), machine learning (ML), and high-frequency trading (HFT) algorithms are no longer futuristic concepts; they’re reshaping how both individual traders and massive institutional players navigate the global currency exchange. This integration is creating exciting opportunities, but also presents significant challenges that need careful consideration.
Technological advancements are automating many aspects of forex trading, leading to increased efficiency and speed. AI-powered tools can analyze vast datasets of market data, news sentiment, and economic indicators far quicker and more comprehensively than any human trader. This allows for the identification of patterns and opportunities that might be missed by traditional methods. Machine learning algorithms, in particular, are becoming increasingly sophisticated in predicting price movements and optimizing trading strategies based on historical data and real-time market conditions. This enhanced analytical capability empowers traders with more informed decision-making, potentially leading to higher profitability.
AI and Machine Learning’s Impact on Forex Trading
AI and ML are revolutionizing forex trading by automating tasks such as market analysis, order execution, and risk management. For example, AI-powered sentiment analysis tools can process news articles and social media posts to gauge market sentiment towards specific currencies, providing traders with a valuable edge. Meanwhile, ML algorithms can be trained to identify profitable trading patterns and automatically execute trades based on pre-defined parameters, minimizing emotional biases and maximizing efficiency. This level of automation is particularly beneficial for high-frequency trading, where speed and precision are paramount. The use of AI in algorithmic trading allows for the development of complex trading strategies that adapt to changing market conditions in real-time, offering significant advantages over traditional methods. For instance, an AI-powered algorithm might dynamically adjust its trading strategy based on news events or shifts in volatility, enhancing its ability to capitalize on fleeting opportunities.
Implications for Individual and Institutional Traders, The Top Forex Trading Strategies for 2025
The implications of these technological advancements are far-reaching. For individual traders, AI-powered trading platforms and analytical tools offer access to sophisticated strategies previously only available to institutional investors. This democratization of advanced trading techniques levels the playing field, enabling smaller players to compete more effectively. However, it also increases the importance of understanding the underlying technology and its limitations. Institutional investors, on the other hand, are leveraging AI and ML to enhance their already robust trading operations. They’re using these technologies to refine their risk management strategies, optimize portfolio allocation, and improve the speed and accuracy of their trades. The competition among institutions is becoming increasingly fierce, driven by the need to stay ahead in this technologically advanced landscape. The integration of AI and ML allows for faster execution of trades, potentially leading to significant advantages in a highly competitive environment. A concrete example would be a large hedge fund using AI to identify and exploit arbitrage opportunities across different currency pairs, gaining a slight edge over competitors.
Challenges and Opportunities in Technological Integration
While the opportunities are vast, the integration of technology in forex trading also presents challenges. The increasing reliance on algorithms raises concerns about market manipulation and the potential for systemic risks. The complexity of AI and ML models can make it difficult to understand their decision-making processes, leading to a lack of transparency and accountability. Furthermore, the cost of developing and maintaining sophisticated AI-powered trading systems can be prohibitive for many smaller players. Despite these challenges, the potential rewards are substantial. The continued development and refinement of AI and ML technologies will likely lead to even more sophisticated trading strategies, improved risk management, and increased efficiency in the forex market. The opportunities lie in adapting to these advancements, mastering the new tools, and mitigating the associated risks. The forex market of the future will be defined by its technological sophistication, demanding a new breed of traders who are comfortable navigating this complex landscape.
Final Summary
So, there you have it – your roadmap to navigating the dynamic world of forex trading in 2025. Remember, consistent learning, disciplined risk management, and adapting to market changes are key to success. Don’t just passively read this; actively experiment, refine your strategies, and watch your portfolio flourish. The future of your finances is in your hands. Now go get ’em!
Commonly Asked Questions: The Top Forex Trading Strategies For 2025
What’s the minimum amount I need to start forex trading?
The minimum amount varies by broker, but many allow you to start with a few hundred dollars. However, starting small is wise until you gain experience.
How much time do I need to dedicate to forex trading daily?
That depends on your chosen strategy. Scalping requires constant monitoring, while swing trading might only need a few checks per day. Find a strategy that fits your lifestyle.
Is forex trading legal everywhere?
Forex trading’s legality depends on your location. Regulations vary, so check your country’s rules before you start.
Are there any free resources to learn more about forex trading?
Yes! Many websites, educational platforms, and YouTube channels offer free forex trading tutorials and information. However, be cautious and verify the credibility of sources.


