How to Use Elliott Wave Theory in Forex Trading: Unlocking the secrets of the market’s hidden rhythm. Think you can predict the unpredictable? Elliott Wave Theory suggests you might be closer than you think. This isn’t some mystical mumbo-jumbo; it’s a technical analysis tool that analyzes market psychology through distinct wave patterns. We’ll break down the motive and corrective waves, show you how to spot them on charts, and even reveal how Fibonacci retracements can supercharge your predictions. Get ready to ride the wave – the forex wave, that is.
Mastering Elliott Wave Theory isn’t a walk in the park; it requires practice and a keen eye for detail. But once you grasp the core principles, you’ll be equipped to identify potential entry and exit points with increased confidence. We’ll explore various trading strategies, risk management techniques tailored to this approach, and even dissect real-world examples of both successful and unsuccessful trades – because learning from mistakes is just as crucial as celebrating wins. This guide is your roadmap to navigating the complexities of Elliott Wave analysis and applying it to your forex trading journey.
Introduction to Elliott Wave Theory in Forex
Elliott Wave Theory posits that market prices move in specific patterns, reflecting the collective psychology of investors. These patterns, called waves, are categorized as either motive (impulsive) or corrective, and their interplay provides insights into potential price movements. Understanding these wave structures is crucial for Forex traders seeking to anticipate market trends and manage risk effectively.
Basic Principles of Elliott Wave Theory
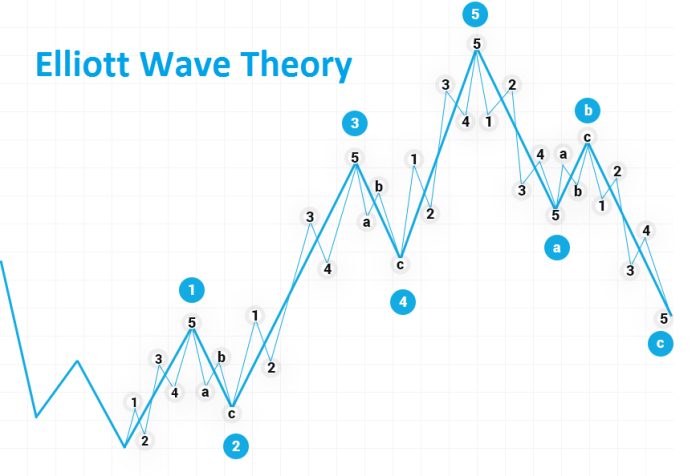
The core principle is that market prices unfold in a fractal pattern of five motive waves (moving in the direction of the main trend) followed by three corrective waves (moving against the main trend). These eight waves together form a complete cycle. Motive waves are further subdivided into five smaller waves, while corrective waves are subdivided into three. This self-similar structure repeats across different timeframes, from minutes to years, creating a hierarchical wave structure. The theory relies on the interpretation of these wave patterns to predict future price movements and identify potential trading opportunities. A key aspect is understanding the impulsive nature of motive waves and the counter-trend behavior of corrective waves.
Motive and Corrective Wave Patterns
Motive waves represent the primary trend and are characterized by five distinct sub-waves labeled 1, 2, 3, 4, and 5. Wave 3 is typically the longest and strongest, while wave 2 and 4 are corrections. Corrective waves move against the main trend and are typically composed of three sub-waves labeled A, B, and C. Corrective patterns can take several forms, including zigzags, flats, and triangles, each with its own unique characteristics. Identifying these patterns accurately is essential for determining the strength and direction of the trend. For example, a strong upward trend might be characterized by a clear five-wave motive pattern, followed by a three-wave corrective pattern before resuming the upward movement.
Examples of Elliott Wave Patterns in Forex Charts
Imagine a EUR/USD chart showing a five-wave upward movement. Wave 1 might show a steady increase, followed by a minor correction (wave 2). Wave 3 would then exhibit a significant price surge, potentially exceeding the gains of wave 1. Wave 4 would present a less severe correction than wave 2, followed by a final push (wave 5) before a reversal. Subsequently, a three-wave corrective pattern (A, B, C) would likely appear, pulling the price back before another potential five-wave motive sequence begins. These patterns are not always perfectly clear-cut; often, they require experience and practice to identify with accuracy. The identification of these waves is subjective and requires significant experience and skill.
Comparison of Motive and Corrective Waves
| Characteristic | Motive Waves | Corrective Waves | Trading Implications |
|---|---|---|---|
| Number of Sub-waves | Five | Three | Five-wave patterns suggest continuation of the trend; three-wave patterns suggest a potential trend reversal or correction. |
| Direction | In the direction of the main trend | Against the direction of the main trend | Identify potential entry and exit points based on wave structure. |
| Wave 3 | Usually the longest and strongest | N/A | Look for strong momentum during wave 3 for potential long positions. |
| Wave 4 | Typically a shallow correction | N/A | Potential opportunity for long positions during wave 4 pullback. |
| Wave A, B, C | N/A | Wave C is usually the most significant in terms of price movement | Potential short positions during wave C. |
Identifying Wave Patterns in Forex Charts
Elliott Wave Theory, while powerful, isn’t a crystal ball. Successfully identifying wave patterns in forex charts requires practice, patience, and a keen eye for detail. Many traders struggle with the subjectivity inherent in the theory, often leading to misinterpretations and ultimately, flawed trading decisions. This section will explore common challenges, reliable identification methods, and the crucial role of Fibonacci retracements in refining your Elliott Wave analysis.
Challenges in Identifying Elliott Wave Patterns
The inherent subjectivity of Elliott Wave Theory is its biggest hurdle. Different traders might interpret the same chart differently, leading to conflicting wave counts. Market noise, particularly in volatile currency pairs, can obscure the underlying wave structure, making it difficult to distinguish between impulsive and corrective waves. Furthermore, the complexity of higher-degree waves, encompassing multiple lower-degree waves, adds another layer of difficulty. Finally, the lack of a universally agreed-upon set of strict rules contributes to the interpretive challenges. The theory’s flexibility, while allowing for adaptability, can also lead to inconsistencies in analysis.
Methods for Identifying Impulsive and Corrective Waves
Impulsive waves, representing the primary trend, are typically characterized by five sub-waves (labeled 1, 2, 3, 4, 5), with wave 3 being the longest and wave 2 retracing less than wave 1. Corrective waves, which move against the primary trend, usually consist of three sub-waves (labeled A, B, C), with wave A and C moving in the same direction, and wave B retracing part of wave A. However, these are just guidelines; exceptions exist. Careful observation of wave structure, price action, and momentum indicators are essential. For example, looking for divergences between price and momentum oscillators (like RSI or MACD) can help confirm wave structures. Higher highs and higher lows in impulsive waves, and lower highs and lower lows in corrective waves, also provide visual confirmation. Recognizing the characteristic shapes of various corrective patterns, like zigzags, flats, and triangles, further enhances identification accuracy.
Using Fibonacci Retracements with Elliott Wave Analysis
Fibonacci retracement levels are frequently used to predict potential support and resistance levels within Elliott Wave structures. These levels, typically at 23.6%, 38.2%, 50%, 61.8%, and 78.6% of a preceding wave’s move, often coincide with wave 2 and 4 retracements in impulsive waves and wave B retracements in corrective waves. By identifying these retracement levels, traders can gain a clearer understanding of potential reversal points and enhance the accuracy of their wave counts. For instance, if wave 1 ends at 1.1000 and wave 2 retraces to 1.0780 (a 23.6% retracement), it strengthens the probability of the wave count being accurate. This combination of wave structure analysis and Fibonacci retracement enhances the predictability of potential price movements.
Step-by-Step Guide to Identifying Wave Patterns
Let’s consider a hypothetical EUR/USD chart. Assume the price has been trending upwards.
- Identify the Main Trend: Observe the overall direction of the price movement. In this example, the main trend is upward.
- Count the Waves: Begin identifying five distinct waves in the upward direction. Label these 1, 2, 3, 4, and 5. Pay close attention to the relative lengths of these waves, with wave 3 typically being the longest.
- Analyze Wave Structure: Check if wave 2 retraces less than wave 1, and if wave 4 retraces less than wave 3. Look for specific corrective patterns in waves 2 and 4.
- Confirm with Fibonacci Retracements: Measure the length of wave 1 and apply Fibonacci retracements. See if wave 2 and wave 4 bottoms coincide with key Fibonacci levels (23.6%, 38.2%, etc.).
- Identify Corrective Waves: After the five-wave impulsive sequence, anticipate a three-wave corrective sequence (A, B, C) moving downwards. Analyze the structure of these waves similarly.
- Consider Higher-Degree Waves: Recognize that these five-wave and three-wave sequences might be part of larger, higher-degree waves. The broader context is crucial.
Remember, this is a simplified example. In reality, identifying wave patterns requires significant experience and practice.
Applying Elliott Wave Theory to Forex Trading Strategies

Elliott Wave Theory isn’t just about identifying patterns; it’s a powerful tool for crafting robust forex trading strategies. By understanding the underlying principles of motive and corrective waves, traders can pinpoint potential entry and exit points with greater precision, ultimately improving their risk-reward ratios. This section explores various strategies and risk management techniques within the framework of Elliott Wave analysis.
Trading Strategies Based on Elliott Wave Theory
Several trading strategies leverage Elliott Wave principles. One common approach focuses on identifying the end of a corrective wave (wave 4) as a potential buying opportunity, anticipating the subsequent impulsive move (wave 5). Conversely, traders might short sell at the end of an impulsive wave (wave 5), anticipating the ensuing correction (wave A of a corrective wave). The success of these strategies hinges on accurate wave identification and precise timing. A crucial element is understanding the different types of corrective waves (zigzags, flats, triangles) and their implications for potential price reversals. For instance, a triangle pattern often signifies a period of consolidation before a significant breakout.
Identifying Entry and Exit Points Using Elliott Wave Analysis
Identifying entry and exit points using Elliott Wave analysis requires a deep understanding of wave structures and Fibonacci relationships. Let’s consider a hypothetical example. Suppose we identify a five-wave impulsive structure in the EUR/USD pair. The completion of wave 5, often characterized by an exhaustion move, could signal a potential short entry. The stop-loss could be placed above the high of wave 5, while the target could be calculated based on Fibonacci projections or the anticipated depth of the corrective wave A. Conversely, the completion of wave 4 in a corrective wave might signal a buying opportunity, with a stop-loss below wave 4’s low and a profit target based on projected wave 5’s potential. Remember, these are hypothetical scenarios and require confirmation from other technical indicators.
Risk Management Techniques within an Elliott Wave Framework
Effective risk management is paramount in any trading strategy, and Elliott Wave analysis is no exception. One key aspect is position sizing. Traders should avoid overexposing their capital to a single trade, especially when relying on wave counts that might be subject to interpretation. Another important consideration is the use of stop-losses. Stop-losses should be placed strategically to limit potential losses, perhaps at the end of a completed wave or a significant support/resistance level. Furthermore, taking profits at key Fibonacci retracement levels or the anticipated end of a wave can enhance risk management. The use of trailing stop-losses, which adjust as the trade moves in your favor, is another valuable technique.
Potential Trading Signals Based on Specific Wave Patterns
Understanding specific wave patterns is crucial for generating trading signals. Here’s a summary of potential signals:
- Five-wave impulsive pattern completion (wave 5): Potential short entry.
- Three-wave corrective pattern completion (wave 4): Potential long entry.
- Triangle pattern breakout: Strong directional signal, often leading to a significant price move.
- Double or triple three patterns: Complex corrective patterns signaling potential reversals.
- Leading diagonal: A five-wave structure that appears within a larger corrective wave, often followed by a strong reversal.
Remember that these are just potential signals, and confirmation from other technical indicators or fundamental analysis is always recommended before entering a trade. The accuracy of Elliott Wave analysis depends heavily on the trader’s experience and ability to correctly identify wave patterns. Misinterpreting wave structures can lead to significant losses.
Advanced Elliott Wave Concepts in Forex
Mastering Elliott Wave Theory in forex trading goes beyond simply identifying basic impulse and corrective waves. To truly leverage its predictive power, understanding advanced concepts is crucial. These concepts allow for a more nuanced and accurate interpretation of market movements, leading to improved trading decisions. This section delves into the intricacies of wave extensions, truncations, Fibonacci ratios, and the significance of different wave degrees.
Wave Extensions and Truncations
Wave extensions occur when one of the impulse waves (waves 1, 3, or 5) significantly extends beyond the typical length. This extension often makes the extended wave far longer than the other impulse waves in that same degree. Identifying an extension is key because it alters the projected target price for the entire motive wave. Conversely, a truncation occurs when one of the impulse waves, usually wave 5, is significantly shorter than anticipated. This suggests a potential weakening of the prevailing trend and often precedes a reversal. Recognizing both extensions and truncations requires careful observation of wave proportions and relationships. A truncated fifth wave, for instance, might be only 61.8% or even less of the length of wave 3, signaling a potential trend reversal. Experienced traders use these deviations from expected wave patterns to anticipate significant price movements.
Fibonacci Ratios in Elliott Wave Analysis
Fibonacci ratios, derived from the Fibonacci sequence (0, 1, 1, 2, 3, 5, 8, 13, etc.), are fundamental to Elliott Wave analysis. These ratios (e.g., 0.618, 0.382, 1.618, 2.618) represent common retracement levels and projection targets within wave structures. For example, a corrective wave might retrace 38.2% or 61.8% of the preceding impulse wave’s move. Similarly, the target price for a subsequent impulse wave can often be projected using these ratios based on the length of the previous wave. Mastering the application of Fibonacci ratios enhances the precision of Elliott Wave predictions and helps traders identify potential support and resistance levels. Consider a scenario where wave 1 moves 100 pips. A 61.8% retracement would imply a corrective wave 2 of approximately 61.8 pips.
Different Wave Degrees and Their Relationships
Elliott Wave Theory posits that market movements occur across various degrees, each representing a different timeframe and scale. Understanding these different degrees is essential for contextualizing price action and developing robust trading strategies. The various degrees are hierarchical, with smaller degrees nested within larger ones.
- Grand Supercycle: The longest-term wave, spanning decades or even centuries. Characterized by massive secular trends.
- Supercycle: A major long-term trend lasting several years or decades. Represents a significant portion of a Grand Supercycle.
- Cycle: A significant trend lasting for several months to a couple of years. A component of a Supercycle.
- Primary: A trend lasting for several weeks to months. A component of a Cycle wave.
- Intermediate: A trend lasting for several days to weeks. A component of a Primary wave.
- Minor: A trend lasting for several hours to a day. A component of an Intermediate wave.
- Minute: A trend lasting for several minutes to an hour. A component of a Minor wave.
- Minuette: A very short-term trend lasting for minutes or even seconds. A component of a Minute wave.
Imagine a fractal-like structure: a Grand Supercycle is made up of Supercycles, which in turn are made of Cycles, and so on. Each degree exhibits the same impulse and corrective wave patterns, allowing traders to analyze market movements across different timeframes. For example, a trader might identify a primary degree uptrend while simultaneously recognizing a minor degree correction within that larger trend. This multi-timeframe analysis provides a more comprehensive understanding of market dynamics.
Limitations and Considerations of Elliott Wave Theory: How To Use Elliott Wave Theory In Forex Trading
Elliott Wave Theory, while a powerful tool for forex traders, isn’t a crystal ball. Its subjective nature and inherent complexities mean it’s crucial to understand its limitations before relying on it solely for trading decisions. Ignoring these limitations can lead to significant losses. This section explores these pitfalls and offers strategies for mitigating the risks involved.
The biggest hurdle with Elliott Wave Theory is its inherent subjectivity. Unlike indicators with clear-cut buy/sell signals, Elliott Wave interpretation relies heavily on the analyst’s judgment. Different analysts might identify different wave patterns on the same chart, leading to conflicting trading signals. This subjectivity isn’t a flaw in the theory itself, but a critical factor to acknowledge and manage effectively. The flexibility in interpretation, while offering potential insights, also opens the door to misinterpretations and inaccurate predictions.
Subjective Nature of Elliott Wave Interpretation
The lack of universally agreed-upon rules for identifying wave patterns contributes significantly to the subjective nature of Elliott Wave analysis. While the basic principles remain consistent, the nuances of wave formation and the identification of specific wave degrees (e.g., Grand Supercycle, Supercycle, Cycle, Primary, Intermediate, Minor, Minute, Minuette) can be challenging. For instance, what one analyst might identify as a corrective wave, another might interpret as the beginning of a new impulse wave. This ambiguity necessitates a deep understanding of the theory and a disciplined approach to analysis. Relying solely on one analyst’s interpretation is risky; comparing interpretations from multiple sources can provide a more balanced perspective. Consider the example of a head and shoulders pattern forming within a larger corrective wave. One analyst might interpret the head and shoulders as a strong bearish signal, prompting a short position. Another, focusing on the larger corrective wave structure, might view the head and shoulders as a minor correction within an overall uptrend, ignoring the bearish signal.
Mitigating Risks Associated with Subjective Interpretation
Several strategies can help mitigate the risks associated with the subjective nature of Elliott Wave analysis. Firstly, developing a robust trading plan that incorporates risk management techniques is crucial. This includes setting stop-loss orders to limit potential losses and taking profits at predetermined levels. Secondly, combining Elliott Wave analysis with other technical indicators can provide confirmation signals and reduce reliance on subjective interpretation alone. For example, using moving averages or RSI alongside Elliott Wave analysis can help identify potential support and resistance levels and confirm the direction of the trend. Thirdly, focusing on higher-degree wave patterns can reduce the impact of minor discrepancies in the interpretation of lower-degree waves. Analyzing the larger trend can provide a more reliable context for interpreting shorter-term price movements. Finally, backtesting trading strategies based on Elliott Wave analysis is vital to assess their effectiveness and refine the approach. This helps identify potential biases and improve the accuracy of future predictions.
Combining Elliott Wave Analysis with Other Technical Indicators
Integrating Elliott Wave analysis with other technical indicators enhances the accuracy and reliability of trading decisions. For example, using the Relative Strength Index (RSI) can help confirm overbought or oversold conditions, aligning with the expected momentum within an Elliott Wave impulse or corrective structure. Similarly, moving averages can highlight potential support and resistance levels, corroborating the anticipated price action based on Elliott Wave projections. A combination of Elliott Wave analysis identifying a potential impulsive five-wave pattern, followed by confirmation from RSI showing momentum supporting the bullish move, and finally, confirmation from a moving average acting as support, significantly strengthens the trading signal. Conversely, if the RSI is not overbought during a bullish five-wave pattern, or the moving average is broken, it would indicate a potential weakness in the signal, prompting a more cautious approach or even avoidance of the trade. This multi-faceted approach reduces reliance on a single indicator’s interpretation and minimizes the risks associated with subjective Elliott Wave analysis.
Illustrative Examples of Elliott Wave Analysis in Forex
Elliott Wave Theory, while powerful, isn’t a crystal ball. Success hinges on accurate pattern identification and understanding market context. Let’s examine both successful and unsuccessful applications to illustrate the theory’s nuances and potential pitfalls. Remember, even the most experienced traders experience losses; the key is learning from mistakes.
Successful Trade Example: EUR/USD Uptrend
This example focuses on a EUR/USD trade where Elliott Wave analysis correctly predicted an uptrend. Imagine a chart showing a five-wave impulsive structure (1-2-3-4-5) clearly visible. Wave 1 shows a sharp increase in price, followed by a corrective pullback in wave 2. Wave 3, the longest and strongest wave, pushes the price significantly higher. Wave 4 is a shallower correction, and wave 5 completes the impulsive pattern with another strong upward move. The chart would visually demonstrate the clear distinction between impulsive and corrective waves, with wave 2 and 4 retracing less than wave 1 and 3 respectively. The trader, having identified this pattern, would have entered a long position during wave 4’s correction, anticipating the final leg of the impulse (wave 5). A stop-loss order would have been placed below the low of wave 4, limiting potential losses. The take-profit order would have been set based on projected Fibonacci retracement levels or the anticipated end of wave 5. The subsequent price movement confirmed the prediction, resulting in a profitable trade. The image would vividly show the clean five-wave structure, with clear support and resistance levels identified at the end of waves 2 and 4. The clear Fibonacci retracement levels further validated the wave structure and helped to determine the take-profit target.
Unsuccessful Trade Example: GBP/USD False Breakout, How to Use Elliott Wave Theory in Forex Trading
This example highlights a scenario where misinterpreting Elliott Wave patterns led to a loss. Let’s picture a chart depicting a potential five-wave structure forming within a larger corrective pattern. However, what appeared to be a wave 5 impulsive move turned out to be a false breakout. The trader, anticipating a continuation of the uptrend based on the perceived five-wave structure, entered a long position. The image would show how the price briefly broke above the previous high, mimicking a wave 5 completion, before reversing sharply. The trader failed to recognize the broader context; the apparent wave 5 was actually a part of a larger corrective pattern, perhaps a triangle or zigzag. The lack of confirmation from other technical indicators, such as volume or RSI, compounded the error. The stop-loss order, likely placed above the high of the “false wave 5,” was triggered, resulting in a loss. The image would clearly show the subsequent downward movement, revealing the true nature of the pattern and the failure of the initial wave interpretation. This example underscores the importance of combining Elliott Wave analysis with other technical indicators and considering the broader market context to avoid such misinterpretations.
Ultimate Conclusion
So, you’ve cracked the code (sort of). Elliott Wave Theory in forex trading isn’t a crystal ball, but a powerful tool to enhance your trading strategy. Remember, mastering this technique takes time and discipline. Consistent practice, understanding the limitations, and combining it with other indicators will significantly improve your accuracy. The market’s rhythm is complex, but with the right approach, you can learn to dance to its beat. Ready to ride the wave? Let’s go.
User Queries
What are the psychological implications of Elliott Wave Theory?
Elliott Wave Theory posits that market movements are driven by mass psychology, with waves reflecting shifts in investor sentiment – fear, greed, and so on. Understanding these psychological drivers can help anticipate future price action.
How reliable is Elliott Wave Theory?
Its subjectivity is a major drawback. Different analysts can interpret the same chart differently. Combining it with other forms of technical analysis increases reliability.
Can I use Elliott Wave Theory with other indicators?
Absolutely! Combining it with indicators like moving averages, RSI, or MACD can provide confirmation signals and reduce the risk of misinterpretations.
What are some common mistakes beginners make with Elliott Wave?
Overfitting past patterns to current price action, ignoring context, and failing to use proper risk management are common pitfalls.
Enhance your insight with the methods and methods of How to Trade Forex Using Price Action.
Remember to click Understanding Forex Market Liquidity to understand more comprehensive aspects of the Understanding Forex Market Liquidity topic.


