The Importance of Backtesting in Forex Trading: Think you’ve cracked the code to forex riches? Before you dive headfirst into the volatile world of currency trading, let’s talk about a crucial step often overlooked: backtesting. It’s not just about checking if your strategy *could* work; it’s about proving it *will* work, minimizing risk, and maximizing your chances of success. This isn’t some dusty academic exercise; it’s your secret weapon in the forex arena. We’ll unravel the mysteries of backtesting, from choosing the right data to interpreting the results, and show you how to turn this powerful tool into your personal forex guru.
This guide will walk you through the entire backtesting process, from defining what backtesting even is and the different types you can use to developing and testing your strategies, interpreting the results, and finally, optimizing and refining your approach to risk management. We’ll cover essential data requirements, crucial performance metrics, and even the pitfalls to avoid – like over-optimization. By the end, you’ll be equipped to confidently approach the forex market with a battle-tested strategy.
Defining Backtesting in Forex Trading
Backtesting, in the world of forex trading, is like a rigorous trial run for your trading strategies before you risk your hard-earned cash. It involves using historical market data to simulate how your strategy would have performed in the past. This allows you to identify potential flaws, optimize your approach, and ultimately increase your chances of success in live trading. Think of it as a virtual trading arena where you can test your mettle without the sting of real losses.
Backtesting helps you separate hype from reality. Many trading systems look great on paper, but only backtesting can reveal their true performance under various market conditions. By subjecting your strategies to the scrutiny of historical data, you can identify potential weaknesses and adjust your approach accordingly. This proactive approach can save you significant financial losses down the line.
Types of Backtesting Strategies
There are two primary methods for backtesting: manual and automated. Manual backtesting involves painstakingly reviewing historical price charts and applying your trading rules by hand. This is time-consuming but offers a deeper understanding of your strategy’s nuances. Automated backtesting, on the other hand, utilizes specialized software or programming to quickly analyze vast amounts of data, providing a more efficient and comprehensive analysis. Choosing between these methods often depends on your technical skills and the complexity of your trading strategy.
A Step-by-Step Guide to Simple Backtesting
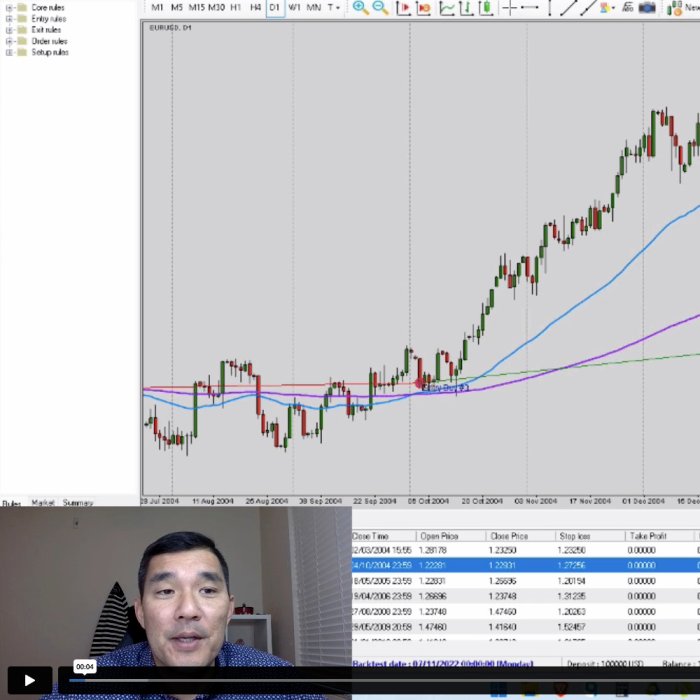
Let’s Artikel a simple backtesting process. First, you’ll need to select the historical data you’ll be using. This typically involves downloading price data (open, high, low, close) for a specific currency pair over a chosen time period. Next, define your trading strategy clearly, including entry and exit rules, stop-loss and take-profit levels, and any indicators you’ll be using. Then, meticulously apply your rules to the historical data, recording each trade’s outcome (profit or loss). Finally, analyze the results, calculating key performance metrics such as win rate, average profit/loss, and maximum drawdown.
Example of a Backtesting Plan
Consider a simple moving average crossover strategy for the EUR/USD pair. Our backtesting plan will use daily data from January 1, 2018, to December 31, 2022. We’ll use a 20-period and a 50-period simple moving average. The entry signal will be a crossover of the 20-period MA above the 50-period MA (buy signal), and a crossover of the 20-period MA below the 50-period MA (sell signal). Stop-loss will be set at 20 pips, and take-profit at 40 pips. We’ll then analyze the results to assess the strategy’s profitability and risk profile over this five-year period. This detailed plan ensures consistency and allows for accurate evaluation of the strategy’s performance.
Data Requirements for Effective Backtesting
Backtesting, while a powerful tool in forex trading, is only as good as the data it uses. Garbage in, garbage out – this adage holds especially true in the world of algorithmic trading and strategy optimization. Using the right data is crucial for generating reliable results and avoiding costly mistakes. Think of it like building a house – you wouldn’t use substandard materials, would you?
High-quality historical forex data forms the bedrock of any successful backtest. The accuracy and completeness of your data directly impact the validity of your results. Relying on flawed data can lead to over-optimistic performance estimations, resulting in significant losses when your strategy is deployed in live trading. Essentially, you’re building your trading strategy on a shaky foundation.
Importance of High-Quality Historical Forex Data
High-quality historical forex data is characterized by its accuracy, completeness, and consistency. Accuracy refers to the precision of the price quotes and other data points. Completeness ensures that there are no missing data points or gaps in the historical record. Consistency implies that the data is formatted uniformly and adheres to a standardized structure. This consistency is vital for preventing errors during the backtesting process. Imagine a dataset with random price jumps or missing ticks – your backtesting results would be utterly unreliable.
Potential Pitfalls of Using Inaccurate or Incomplete Data, The Importance of Backtesting in Forex Trading
Using inaccurate or incomplete data can lead to several pitfalls. Firstly, it can produce overly optimistic results. A backtest using incomplete data might miss periods of significant market volatility, leading to a falsely inflated perception of your strategy’s profitability. Secondly, it can mask underlying flaws in your trading strategy. A strategy that performs well on incomplete data might fail miserably when exposed to the full spectrum of market conditions. Finally, it can lead to significant financial losses when the strategy is implemented in live trading. This is because the strategy’s performance was based on a skewed representation of reality.
Key Data Points Needed for a Comprehensive Backtest
A comprehensive backtest requires several key data points to accurately simulate real market conditions. These include:
* Price Data: This is the most fundamental data point, encompassing the open, high, low, and close (OHLC) prices for each time period (e.g., every minute, hour, or day).
* Volume Data: Trading volume provides insights into market liquidity and the strength of price movements. High volume often confirms a price trend, while low volume can suggest weakness.
* Time Data: Accurate timestamps are crucial for aligning trades with specific market events and ensuring the correct sequencing of data.
Comparison of Different Data Sources
Choosing the right data source is critical. Different providers offer varying levels of quality, accuracy, and cost. Here’s a comparison:
| Data Source | Accuracy | Completeness | Cost |
|---|---|---|---|
| Broker Historical Data | Generally High (depends on broker) | Can be incomplete, especially for older data | Often included with trading accounts, otherwise variable |
| Commercial Data Providers (e.g., Dukascopy, FXCM) | High | Generally High | High |
| Free Online Sources | Variable, often lower | Often incomplete or with significant gaps | Free |
| Open-Source Data Repositories | Variable, needs careful vetting | Variable | Free |
Developing and Testing Trading Strategies
Backtesting isn’t just about running a strategy; it’s about rigorously evaluating its potential and refining it for real-world application. This involves selecting appropriate strategies, testing their performance under various market conditions, and incorporating robust risk management. Only through this iterative process can you build a trading system with a higher probability of success.
Choosing the right strategy is crucial. Different strategies suit different traders and market conditions. Some thrive in trending markets, while others excel in range-bound environments. Understanding your risk tolerance and preferred trading style is key to selecting a suitable strategy.
Forex Trading Strategies Suitable for Backtesting
Several forex trading strategies lend themselves well to backtesting. These strategies offer diverse approaches to market analysis and profit generation. By comparing their backtested performance, you can gain insights into their strengths and weaknesses.
- Moving Average Crossover Strategy: This classic strategy uses the crossover of two moving averages (e.g., a fast 50-period and a slow 200-period moving average) to generate buy and sell signals. A buy signal occurs when the fast MA crosses above the slow MA, indicating an upward trend, while a sell signal occurs when the fast MA crosses below the slow MA.
- Relative Strength Index (RSI) Strategy: The RSI is a momentum oscillator that identifies overbought and oversold conditions. A buy signal is generated when the RSI falls below a certain threshold (e.g., 30), suggesting oversold conditions, and a sell signal is generated when the RSI rises above a certain threshold (e.g., 70), suggesting overbought conditions.
- Support and Resistance Strategy: This strategy identifies key support and resistance levels on a price chart. A buy signal is generated when the price bounces off a support level, and a sell signal is generated when the price breaks through a resistance level.
Comparative Performance of Forex Trading Strategies
Let’s imagine a hypothetical backtest comparing these three strategies over a five-year period. Assume a consistent risk management approach (e.g., 1% risk per trade).
| Strategy | Average Win Rate | Average Profit per Trade | Maximum Drawdown | Annualized Return |
|---|---|---|---|---|
| Moving Average Crossover | 55% | $150 | -10% | 12% |
| RSI Strategy | 60% | $120 | -8% | 10% |
| Support and Resistance | 45% | $200 | -15% | 15% |
Note: These are hypothetical results and actual performance may vary significantly.
Incorporating Risk Management Rules into Backtesting
Risk management is paramount in forex trading. Backtesting allows you to simulate various risk management rules and assess their impact on your strategy’s performance. Key risk management rules include:
- Position Sizing: Determining the appropriate amount of capital to allocate to each trade based on your risk tolerance. A common approach is to risk a fixed percentage (e.g., 1-2%) of your account balance on each trade.
- Stop-Loss Orders: Setting a stop-loss order to limit potential losses on each trade. This order automatically closes your position when the price reaches a predetermined level.
- Take-Profit Orders: Setting a take-profit order to lock in profits when the price reaches a predetermined level.
Common Indicators Used in Forex Backtesting
Various indicators can enhance your backtesting analysis by providing additional insights into market dynamics.
- Moving Averages (MA): Smooth out price fluctuations and identify trends. Different types of MAs (simple, exponential, weighted) exist, each with unique characteristics.
- Relative Strength Index (RSI): Measures the speed and change of price movements to identify overbought and oversold conditions.
- MACD (Moving Average Convergence Divergence): Identifies changes in momentum by comparing two moving averages.
- Bollinger Bands: Show the volatility of an asset’s price by plotting standard deviations around a moving average.
- Stochastic Oscillator: Compares a security’s closing price to its price range over a given period to show momentum.
Interpreting Backtesting Results
Backtesting, while a powerful tool, isn’t a crystal ball. Understanding its output requires careful interpretation, acknowledging its limitations and potential biases. Simply achieving a high win rate doesn’t guarantee future success; a deeper dive into the metrics is crucial.
Interpreting backtesting results involves analyzing key performance indicators to understand the effectiveness of your trading strategy. This analysis should not only focus on overall profitability but also on the consistency and risk profile of the strategy. A seemingly profitable strategy might mask significant drawdowns or unexpected vulnerabilities.
Key Performance Metrics
Understanding key performance metrics like win rate and average trade profit/loss is vital. Win rate represents the percentage of winning trades, while average trade profit/loss indicates the average profit or loss per trade. High win rate with low average profit per trade might still result in low overall profitability, and vice-versa. A balanced approach, considering both metrics alongside others like maximum drawdown and Sharpe ratio, provides a more holistic picture. For instance, a strategy with a 60% win rate and an average profit of $100 per trade is more profitable than one with a 90% win rate and an average profit of $10.
Potential Biases and Limitations of Backtesting
Backtesting is inherently limited by the data used. Using historical data assumes that market conditions will remain consistent, which is rarely true. Data quality is also paramount; inaccuracies or gaps in the data can significantly skew results. Furthermore, backtesting often overlooks crucial factors like emotional decision-making and unexpected market events that can derail even the most robust strategies. Over-optimization, where a strategy is tweaked until it performs exceptionally well on historical data but poorly in live trading, is a common pitfall.
Transaction Costs and Slippage
Transaction costs, including commissions and spreads, and slippage (the difference between the expected and executed price of a trade) are often ignored in initial backtests, leading to overly optimistic results. Incorporating these real-world factors into your backtesting is crucial for a realistic assessment. A strategy that looks highly profitable without considering these costs might become unprofitable once implemented in a live trading environment. For example, a strategy generating a 10% annual return before transaction costs might only yield 7% after accounting for commissions and slippage.
Typical Backtesting Performance Chart
Imagine a chart with time on the x-axis and equity curve on the y-axis. The equity curve is a line representing the cumulative profit or loss over time. Key components include:
| Component | Description |
|---|---|
| Equity Curve | A line graph showing the cumulative performance of the strategy over the backtesting period. Upswings represent periods of profit, while downswings indicate losses. |
| Maximum Drawdown | The largest peak-to-trough decline during the backtesting period, representing the maximum loss experienced before recovering. |
| Average Trade Profit/Loss | The average profit or loss per trade. |
| Win Rate | The percentage of winning trades. |
| Sharpe Ratio | A measure of risk-adjusted return, showing the excess return per unit of risk. |
Optimizing and Refining Trading Strategies
Backtesting provides a crucial foundation for forex trading strategy development, but it’s not a one-and-done process. The insights gleaned from initial backtests often require refinement and optimization to create a truly robust and profitable system. This iterative process involves adjusting parameters, identifying weaknesses, and ultimately, validating the strategy’s performance in real-world conditions.
Optimizing a trading strategy based on backtesting results is about fine-tuning its parameters to improve its performance metrics, such as profitability, Sharpe ratio, and maximum drawdown. This involves systematically adjusting variables like entry and exit points, stop-loss and take-profit levels, indicators’ settings, and position sizing. The goal is to identify the optimal combination of parameters that yields the best risk-adjusted returns within the tested historical data.
Methods for Optimizing Trading Parameters
Effective optimization involves a structured approach. One common method is to systematically vary one parameter at a time while holding others constant. For example, you might test different stop-loss levels while keeping your take-profit and entry criteria fixed. This allows for isolating the impact of each parameter on the overall performance. Another approach is using grid search or random search algorithms, which systematically test various parameter combinations across a defined range. This can be particularly helpful when dealing with multiple interacting parameters. However, care must be taken to avoid over-optimization.
Over-Optimization and Its Avoidance
Over-optimization occurs when a trading strategy is excessively tailored to fit the specific historical data used in backtesting. This results in a strategy that performs exceptionally well during the backtest but poorly in live trading because it has essentially “memorized” the past data rather than identifying genuine market patterns. A key indicator of over-optimization is an unrealistically high performance during backtesting that fails to translate into real-world profits.
To avoid over-optimization, it’s crucial to use robust out-of-sample testing. This involves splitting the historical data into two sets: an in-sample set for initial strategy development and optimization, and an out-of-sample set for validating the optimized strategy’s performance on unseen data. Furthermore, adhering to a strict parameter selection process, employing walk-forward analysis (testing the strategy on consecutive periods of data), and using realistic transaction costs in the backtest can significantly mitigate the risk of over-optimization. The principle is to aim for a strategy that consistently performs well across different data sets, not just one specific set.
Forward Testing to Validate Backtest Results
Forward testing is the process of applying a backtested and optimized trading strategy to real-market conditions, but without risking real capital. This involves using a demo trading account to execute trades based on the strategy’s signals. This step is critical because it allows you to assess how the strategy performs under live market conditions, including unpredictable events and market noise that aren’t captured in historical data. The performance observed during forward testing should closely resemble the performance observed in the out-of-sample backtesting. Significant discrepancies could indicate over-optimization or other issues with the strategy.
Adjusting a Strategy Based on Backtesting Feedback
Let’s say a backtest reveals that a particular moving average crossover strategy consistently produces false signals during periods of high market volatility. The backtesting feedback suggests adjusting the strategy to incorporate a volatility filter, such as the Average True Range (ATR) indicator. By adding a condition that only allows trades when the ATR is below a certain threshold, the strategy becomes less sensitive to volatile market conditions and may improve its performance. Another example: if a strategy consistently suffers from large drawdowns, adjustments might include tightening stop-loss levels or implementing a position sizing technique that reduces risk during periods of adverse market movement. The key is to use the insights gained from backtesting to systematically refine the strategy, always keeping in mind the importance of avoiding over-optimization and validating the improvements through further backtesting and forward testing.
The Role of Backtesting in Risk Management
Backtesting isn’t just about finding a profitable strategy; it’s your secret weapon for navigating the volatile world of forex. By simulating your strategy on historical data, you gain invaluable insights into its risk profile, allowing you to make informed decisions and protect your capital. This proactive approach is crucial, as even the most profitable strategies can lead to significant losses without proper risk management.
Understanding the risks inherent in your trading strategy is paramount. Backtesting provides a controlled environment to assess these risks before deploying your strategy with real money. This involves analyzing various metrics to gauge potential losses and the frequency of those losses. This allows you to make adjustments to your strategy or your trading approach to mitigate potential problems before they arise.
Assessing Risk Associated with a Trading Strategy
Backtesting allows you to quantify the risk associated with your strategy by analyzing key metrics such as maximum drawdown, average drawdown, and win rate. For example, a strategy showing a high win rate but also a significant maximum drawdown might indicate a high-risk, high-reward approach that requires careful position sizing. Conversely, a strategy with a lower win rate but minimal drawdown might be a more conservative option suitable for risk-averse traders. By examining these metrics across different market conditions, you can get a comprehensive understanding of your strategy’s risk profile.
Determining Appropriate Position Sizing Using Backtesting
Backtesting plays a vital role in determining the optimal position size for your trading strategy. By analyzing historical data, you can simulate various position sizes and observe their impact on your overall profitability and maximum drawdown. For instance, if backtesting reveals that a 1% position size consistently results in acceptable drawdowns while still delivering satisfactory returns, you can confidently use this size in live trading. However, if a 1% position size leads to excessive drawdowns, reducing the position size to 0.5% or less may be necessary to manage risk effectively.
Identifying Potential Drawdown Scenarios
Backtesting helps identify potential drawdown scenarios by simulating your strategy across various market conditions, including periods of high volatility and extended downtrends. For example, by analyzing the performance of your strategy during the 2008 financial crisis or other significant market events, you can gauge its resilience and identify potential weaknesses. This allows you to adjust your strategy or implement additional risk management techniques to mitigate the impact of similar events in the future. Imagine a strategy that performs exceptionally well in trending markets but suffers significantly during periods of sideways consolidation – backtesting would highlight this vulnerability.
Key Risk Management Considerations in Forex Trading
Before diving into live trading, consider these key risk management principles, many of which are illuminated through effective backtesting:
- Diversification: Don’t put all your eggs in one basket. Diversify your trading across different currency pairs and strategies to reduce overall risk.
- Stop-Loss Orders: Always use stop-loss orders to limit potential losses on each trade. Backtesting can help you determine appropriate stop-loss levels.
- Position Sizing: Carefully calculate your position size to avoid risking more than a small percentage of your trading capital on any single trade. Backtesting provides crucial data for this calculation.
- Risk-Reward Ratio: Aim for a favorable risk-reward ratio (e.g., 1:2 or 1:3), where potential profits outweigh potential losses. Backtesting helps you assess the potential risk-reward profile of your strategies.
- Emotional Discipline: Avoid impulsive decisions based on fear or greed. Stick to your trading plan, even during periods of market volatility. Backtesting helps build confidence in your strategy and reduces the likelihood of emotional trading.
- Regular Monitoring and Adjustment: Continuously monitor your trading performance and make necessary adjustments to your strategy based on market conditions and backtesting results. The forex market is dynamic; your approach needs to be as well.
Wrap-Up: The Importance Of Backtesting In Forex Trading
So, there you have it – backtesting isn’t just a good idea; it’s a non-negotiable step for anyone serious about forex trading. It’s the bridge between theory and reality, transforming your trading strategy from a hopeful guess into a well-oiled, profit-generating machine. By understanding the process, utilizing the right data, and correctly interpreting the results, you’ll not only improve your chances of success but also navigate the inherent risks of forex trading with greater confidence. Remember, consistent backtesting is the key to unlocking long-term success in this dynamic market. Don’t gamble with your hard-earned cash; backtest your way to smarter trading.
Question Bank
What’s the difference between manual and automated backtesting?
Manual backtesting involves reviewing historical data and manually applying your trading strategy. Automated backtesting uses software to test your strategy across a large dataset, offering speed and efficiency.
How often should I backtest my strategy?
Regularly! Market conditions change, so retesting is vital. At least quarterly is recommended, especially after significant market events.
Can backtesting guarantee future profits?
No, past performance doesn’t predict future results. Backtesting reduces risk, but it doesn’t eliminate it. It’s a tool for improvement, not a crystal ball.
What are some common backtesting software options?
Many platforms offer backtesting capabilities, from MetaTrader to specialized trading software. Research options to find one that suits your needs and technical skills.
Examine how Day Trading vs Swing Trading in Forex: What’s the Difference? can boost performance in your area.
Further details about The Best Currency Pairs for Forex Trading is accessible to provide you additional insights.


