How to Use the Parabolic SAR in Forex Trading? Unlocking the secrets of this powerful indicator isn’t as daunting as it sounds. We’ll break down the Parabolic SAR, showing you how to decipher its dots, spot trends, and generate buy/sell signals with confidence. Forget confusing jargon; we’re keeping it real and practical, equipping you with the knowledge to navigate the forex market like a pro. This isn’t just theory; we’ll delve into real-world examples, showcasing both successful and unsuccessful trades, so you can learn from both wins and losses.
From understanding the core concepts and parameters to mastering risk management techniques and combining the Parabolic SAR with other indicators, this guide provides a comprehensive approach. We’ll cover everything from identifying strong uptrends and downtrends to mitigating the risks associated with potential false signals. Get ready to elevate your forex trading game!
Introduction to Parabolic SAR
The Parabolic SAR, or Stop and Reverse, is a technical indicator that helps traders identify potential trend reversals in the forex market. Think of it as a trailing stop-loss that dynamically adjusts based on price movements, aiming to stay just behind the price action. It’s designed to help you stay in profitable trades while minimizing losses. Essentially, it’s a visual tool that suggests when a trend might be weakening or reversing, prompting you to consider exiting a position or entering a new one in the opposite direction.
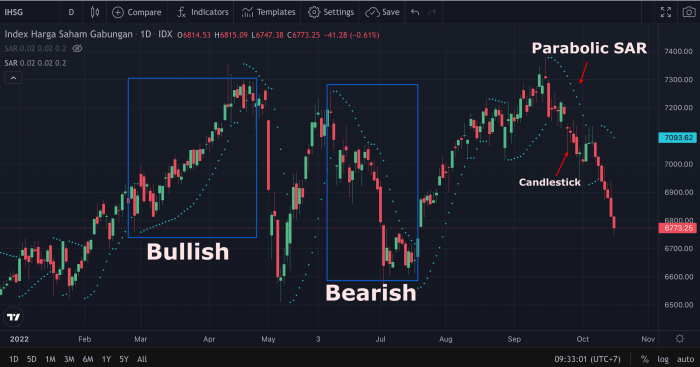
The Parabolic SAR is represented on a chart as a series of dots that trail behind the price. These dots are placed either above or below the price, depending on the prevailing trend. When the dots are below the price, it suggests an uptrend; when they are above, it suggests a downtrend. As the price moves, the SAR dots adjust their position, always attempting to stay behind the price action. A change in the position of the dots—from below the price to above, or vice versa—often signals a potential trend reversal.
Parabolic SAR Visual Representation
Here’s a simplified example of how the Parabolic SAR might appear on a forex chart. Note that real-world data will be far more complex and nuanced.
| Time | Price (USD/JPY) | SAR Value | Trend |
|---|---|---|---|
| 9:00 AM | 145.00 | 144.90 | Up |
| 9:30 AM | 145.20 | 145.00 | Up |
| 10:00 AM | 145.35 | 145.15 | Up |
| 10:30 AM | 145.25 | 145.30 | Down |
| 11:00 AM | 145.10 | 145.28 | Down |
| 11:30 AM | 144.95 | 145.25 | Down |
Parabolic SAR Calculation Parameters
The Parabolic SAR’s behavior is governed by two key parameters: the Acceleration Factor and the Maximum Acceleration Factor.
The Acceleration Factor determines how quickly the SAR adjusts to price changes. A higher acceleration factor causes the SAR to move more aggressively towards the current price, making it more sensitive to short-term price fluctuations. A lower acceleration factor results in a slower, more conservative adjustment. It typically starts at a small value (e.g., 0.02) and increases each time a new high or low is made in the trend.
The Maximum Acceleration Factor sets an upper limit on the acceleration factor. This prevents the SAR from becoming overly aggressive and potentially generating false signals. This parameter helps to prevent whipsaws and provides a degree of stability to the indicator. A common value is 0.2, meaning the acceleration factor will not exceed 0.2, no matter how many consecutive highs or lows are made. This limits how quickly the SAR can “chase” the price.
Identifying Trends with Parabolic SAR
The Parabolic SAR, a technical indicator, isn’t just a pretty picture of dots bouncing around a price chart. It’s a powerful tool for visualizing and confirming trends in the forex market. By observing the position of these dots relative to the price, you can quickly grasp the prevailing momentum and potential trend reversals. Understanding how the SAR dots behave is key to effectively using this indicator.
The Parabolic SAR uses a trailing stop mechanism, represented by those dots. Dots appearing *below* the price signify an uptrend, while dots *above* the price indicate a downtrend. The further the dots are from the price, the stronger the perceived trend. Conversely, dots close to the price suggest a weakening trend or potential reversal. Let’s delve into specific examples to solidify this understanding.
Parabolic SAR Behavior in Different Market Conditions
The following table illustrates how the Parabolic SAR behaves across various market scenarios. Remember, the AF (Acceleration Factor) plays a crucial role in the indicator’s sensitivity. A higher AF results in a more aggressive trailing stop, while a lower AF leads to a more conservative one. This table assumes a relatively constant AF for simplicity.
| Market Condition | Parabolic SAR Position | Price Action | Interpretation |
|---|---|---|---|
| Strong Uptrend | Dots consistently below the price, increasing distance over time. | Price making higher highs and higher lows. | Strong bullish momentum; trend likely to continue. |
| Weak Uptrend | Dots below the price, but distance remains relatively small and fluctuates. | Price making higher highs, but lows are relatively flat or slightly lower. | Bullish momentum weakening; potential for consolidation or reversal. |
| Sideways Movement | Dots oscillating above and below the price, often close to it. | Price fluctuating within a relatively tight range. | No clear trend; the Parabolic SAR is not providing a strong directional signal. |
| Weak Downtrend | Dots above the price, but distance remains relatively small and fluctuates. | Price making lower lows, but highs are relatively flat or slightly higher. | Bearish momentum weakening; potential for consolidation or reversal. |
| Strong Downtrend | Dots consistently above the price, increasing distance over time. | Price making lower lows and lower highs. | Strong bearish momentum; trend likely to continue. |
For instance, imagine the EUR/USD pair experiencing a strong uptrend. The Parabolic SAR dots would trail steadily below the price candles, gradually increasing their distance from the price as the uptrend strengthens. Conversely, during a sharp downtrend in GBP/JPY, the dots would be positioned above the price, moving further away as the price continues its descent. A period of sideways consolidation in USD/CHF might show the dots fluctuating closely around the price, offering no clear indication of the next directional move. The key is to observe the relative position and distance of the dots from the price, coupled with the overall price action, to interpret the trend accurately.
Using Parabolic SAR for Entry and Exit Signals
The Parabolic SAR, while excellent at identifying trends, needs a strategy for translating those trends into actionable buy and sell signals. Simply following the SAR dots isn’t enough; you need a robust approach to manage risk and maximize profits. Combining the SAR with other indicators and a solid risk management plan is key to successful trading.
The most common methods for generating buy and sell signals using the Parabolic SAR involve observing the position of the SAR dots relative to the price action and incorporating confirmation from other indicators. A crossover of the price above the SAR suggests a bullish trend, prompting a buy signal. Conversely, a crossover of the price below the SAR indicates a bearish trend and a sell signal. However, relying solely on this crossover can lead to whipsaws, so additional confirmation is generally recommended.
Buy and Sell Signal Generation with Parabolic SAR
Let’s examine how to generate buy and sell signals using a hypothetical EUR/USD forex chart. Imagine the EUR/USD is trading sideways, and the Parabolic SAR dots are below the price.
- Buy Signal Scenario: The price breaks above a significant resistance level, and simultaneously, the Parabolic SAR dots transition from below the price to above it, indicating a potential upward trend reversal. This is then confirmed by a bullish candlestick pattern, such as a hammer or bullish engulfing pattern, forming at the support level. The trader would then enter a long position (buying EUR/USD). The stop-loss order would be placed below the recent swing low. The take-profit order would be set at a level that corresponds to the trader’s risk tolerance and the potential reward.
- Sell Signal Scenario: The price breaks below a significant support level, and the Parabolic SAR dots move from above the price to below it, suggesting a potential downward trend reversal. This is further reinforced by a bearish candlestick pattern, like a shooting star or bearish engulfing pattern, forming at the resistance level. The trader would then enter a short position (selling EUR/USD). The stop-loss order would be placed above the recent swing high. The take-profit order would be placed at a level that aligns with the trader’s risk management strategy and profit target.
Comparing Parabolic SAR with Other Indicators
Using the Parabolic SAR in isolation can be risky. Combining it with other indicators provides confirmation and reduces the likelihood of false signals. For instance, combining the Parabolic SAR with moving averages (like the 20-period and 50-period simple moving averages) can offer a more comprehensive view of the trend. A bullish crossover of the 20-period MA above the 50-period MA, coupled with the Parabolic SAR dots appearing below the price, would strengthen a buy signal. Conversely, a bearish crossover of the 20-period MA below the 50-period MA, alongside the Parabolic SAR dots moving above the price, would reinforce a sell signal. Similarly, using the Relative Strength Index (RSI) can help identify overbought or oversold conditions, providing additional confirmation or caution before entering a trade. For example, a strong buy signal from the Parabolic SAR combined with an RSI reading below 30 would suggest a potentially strong buying opportunity.
Managing Risk with Parabolic SAR: How To Use The Parabolic SAR In Forex Trading
The Parabolic SAR, while a powerful trend-following indicator, doesn’t eliminate risk. Successful forex trading using this tool hinges on a robust risk management strategy that incorporates appropriate stop-loss and take-profit orders, along with careful position sizing. Ignoring these crucial aspects can quickly lead to significant losses, even with accurate SAR signals.
Successful implementation of the Parabolic SAR requires a disciplined approach to risk management. This involves setting realistic stop-loss and take-profit levels, carefully determining position size to limit potential losses, and understanding how price volatility influences these parameters. Ignoring these aspects can negate any potential profits from accurate SAR signals.
Stop-Loss and Take-Profit Order Placement
Effective stop-loss and take-profit levels are crucial for protecting capital and securing profits. Instead of relying solely on the SAR indicator, consider incorporating other technical analysis tools or price action to refine your order placement. For instance, you might place your stop-loss order just beyond a recent swing low (for long positions) or swing high (for short positions) to provide a cushion against temporary price reversals. Similarly, take-profit levels could be based on Fibonacci retracement levels or support/resistance areas. A flexible approach that adapts to market conditions is key. For example, a trader might set a stop-loss at 2% below their entry price for a long position and a take-profit at a level representing a 1:2 risk-reward ratio.
Position Sizing and Risk Management
Position sizing is paramount. Never risk more capital on a single trade than you can afford to lose. A common strategy is to risk a fixed percentage of your trading account on each trade – typically 1% to 2%. This percentage should be adjusted based on your risk tolerance and the specific trade’s characteristics. For example, if you have a $10,000 trading account and risk 1%, your maximum loss per trade would be $100. This approach helps to prevent catastrophic losses even if several trades go against you. To calculate the appropriate position size, you need to know your stop-loss level and the amount you’re willing to risk per trade.
Calculating Stop-Loss and Take-Profit Levels
Calculating appropriate stop-loss and take-profit levels involves considering both the Parabolic SAR signals and price volatility. A simple method is to use the distance between consecutive SAR dots as a guide for stop-loss placement. For example, if the distance between the last two SAR dots is 10 pips, you might place your stop-loss 10-15 pips beyond the last SAR dot. This provides a buffer against small price fluctuations. Take-profit levels can be set based on the projected target price, or using other technical analysis methods like Fibonacci retracements, support and resistance levels, or chart patterns. Remember that volatility plays a significant role; during periods of high volatility, wider stop-losses might be necessary. For instance, during a period of high volatility in the EUR/USD pair, a trader might use a wider stop-loss of 20 pips, instead of their typical 10 pips, to account for increased price swings.
Limitations and Considerations of Parabolic SAR
The Parabolic SAR, while a powerful tool, isn’t a magic bullet. Like any indicator, it has limitations and can sometimes produce misleading signals, leading to inaccurate trading decisions and potential losses. Understanding these limitations is crucial for responsible and effective use. Ignoring them can significantly impact your trading performance.
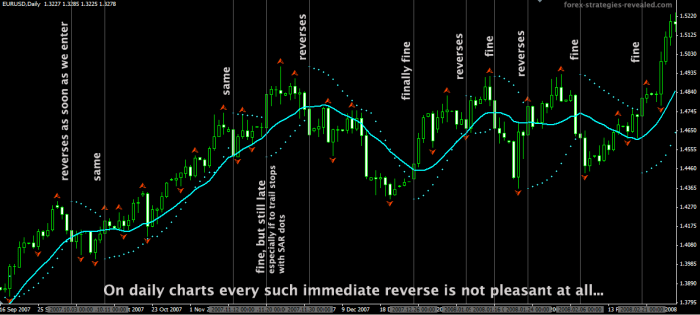
The Parabolic SAR’s inherent sensitivity to price fluctuations means it can generate whipsaws, especially in choppy or sideways markets. This is because the SAR constantly adjusts to the most recent price high or low, reacting quickly to even minor price reversals. This responsiveness, while beneficial in trending markets, can be detrimental in ranging markets, resulting in frequent and potentially unprofitable entries and exits. Furthermore, its lagging nature means it might not always capture the very beginning of a trend, potentially missing out on optimal entry points.
False Signals and Lagging Behavior
The Parabolic SAR’s primary weakness lies in its susceptibility to generating false signals. In sideways or consolidating markets, the indicator can flip back and forth frequently, producing numerous buy and sell signals that don’t translate into profitable trades. This whipsaw effect can quickly erode trading capital. Imagine a scenario where the price consolidates within a tight range. The SAR will oscillate above and below the price, generating alternating buy and sell signals, leading to frequent and potentially losing trades. This is exacerbated by the indicator’s inherent lag; it only reacts to price changes *after* they have occurred, meaning the signal might be delayed, providing a less-than-optimal entry point or even a completely missed opportunity. The lag is particularly pronounced during periods of high volatility or sharp price reversals.
Mitigating Risks Associated with Parabolic SAR Limitations
Effective risk management strategies are paramount when using the Parabolic SAR. One crucial technique is to combine the Parabolic SAR with other indicators or confirmation signals to filter out false signals. For example, integrating it with moving averages or RSI can help to confirm the strength and direction of the trend, reducing the likelihood of acting on spurious signals. Using a stricter risk management approach, such as smaller position sizes or tighter stop-loss orders, can also limit potential losses resulting from false signals or lagging entries. Furthermore, focusing on using the Parabolic SAR primarily in strong trending markets, and avoiding its application in ranging or choppy markets, can significantly improve its efficacy. Finally, backtesting the Parabolic SAR strategy on historical data can help to assess its performance under various market conditions and refine the trading approach to minimize the impact of its limitations. A thorough understanding of the market context and the limitations of the indicator itself is crucial for successful implementation.
Combining Parabolic SAR with Other Indicators
Parabolic SAR, while a powerful tool on its own, can become even more effective when combined with other technical indicators. This synergistic approach allows traders to confirm signals, filter out false breakouts, and gain a more holistic view of market momentum and trend strength. By layering indicators, you can significantly improve your trading accuracy and reduce the risk of entering losing trades.
Combining Parabolic SAR with other indicators offers a more robust trading strategy. Instead of relying solely on the SAR dots to signal reversals, incorporating other indicators provides confirmation and helps filter out noisy signals. This multi-faceted approach reduces the likelihood of whipsaws and improves the overall reliability of your trading decisions. The key is to choose indicators that complement the SAR’s strengths and mitigate its weaknesses.
Indicator Combinations and Their Benefits
The effectiveness of combining Parabolic SAR with other indicators depends on the chosen combination and the trader’s specific trading style. However, several combinations have proven successful over time. The table below highlights some of these combinations and their potential benefits:
| Indicator Combination | Potential Benefits |
|---|---|
| Parabolic SAR + Moving Averages (e.g., 20-period and 50-period) | Confirmation of trend direction; SAR dots bouncing off moving averages suggest strong trend continuation; breakdowns below moving averages can signal trend reversals, reinforcing SAR signals. |
| Parabolic SAR + Relative Strength Index (RSI) | Identifying overbought/oversold conditions; RSI divergence with SAR can provide early warning signals of trend reversals; confirming strong momentum with both indicators increases confidence in trade entries and exits. |
| Parabolic SAR + Moving Average Convergence Divergence (MACD) | Identifying momentum changes; MACD crossovers can confirm or contradict SAR signals; divergence between MACD and SAR can suggest weakening trends. |
Hypothetical Trading Scenario
Let’s imagine a hypothetical scenario involving the EUR/USD currency pair. A trader is using Parabolic SAR and the 20-period Exponential Moving Average (EMA). The price has been trending upwards, with the SAR dots consistently below the price. The 20-period EMA is also sloping upwards, supporting the uptrend. Suddenly, the SAR dots flip above the price, signaling a potential reversal. However, the price remains above the 20-period EMA. This situation creates a conflict. The trader might decide to wait for confirmation – perhaps a break below the EMA – before entering a short position. If the price does break below the EMA, confirming the SAR reversal, the trader would then enter a short trade with a stop-loss order placed above the recent swing high. Conversely, if the price continues to hold above the EMA, the trader might conclude the SAR signal was a false breakout and maintain their long position.
Practical Application and Examples
Applying the Parabolic SAR to real forex trading involves understanding its signals within the context of price action and overall market sentiment. It’s not a standalone holy grail; rather, it’s a tool best used in conjunction with other forms of analysis for confirmation and risk management. Let’s explore how to practically use it and interpret its signals in various market scenarios.
Step-by-Step Application to a Forex Chart
To apply the Parabolic SAR, first, you’ll need a forex charting platform that offers this indicator. Most popular platforms include it as a standard feature. After selecting the Parabolic SAR indicator, you’ll need to adjust its settings, primarily the acceleration factor (AF). A lower AF results in fewer SAR dots, while a higher AF leads to more frequent changes in direction. Experimentation and backtesting are crucial to find an AF that suits your trading style and the specific currency pair you’re trading. Once the indicator is added to your chart, the SAR dots will appear below the price during uptrends and above the price during downtrends. Buy signals are generated when the price crosses above the SAR dot, and sell signals are generated when the price crosses below the SAR dot. Remember to always consider other factors, such as support and resistance levels, before entering a trade.
Successful Trade Example: EUR/USD
Imagine a scenario where the EUR/USD is experiencing a clear uptrend. The Parabolic SAR dots are consistently below the price candles. As the price continues its upward trajectory, a new higher high is formed. Simultaneously, the Parabolic SAR dots maintain their position below the candles, indicating continued bullish momentum. A trader using the Parabolic SAR might enter a long position at the break of a minor resistance level, confirmed by the SAR staying below the price. As the price moves higher, the trader might trail their stop-loss order using the Parabolic SAR dots as a dynamic stop-loss. If the price reverses and closes below a SAR dot, the stop-loss is triggered, limiting potential losses. This trade would be deemed successful if the price continues its upward movement, resulting in a profitable exit before the stop-loss is triggered.
Unsuccessful Trade Example: GBP/JPY, How to Use the Parabolic SAR in Forex Trading
Conversely, consider a scenario where the GBP/JPY is in a sideways, ranging market. The Parabolic SAR generates frequent buy and sell signals as the price oscillates between support and resistance levels. A trader relying solely on the Parabolic SAR might enter multiple trades based on these signals. However, due to the lack of a clear trend, many of these trades could result in losses. The whipsaws inherent in ranging markets can quickly erode trading capital if the Parabolic SAR is used without proper risk management and confirmation from other indicators. This highlights the importance of understanding market conditions before using the Parabolic SAR.
Interpreting Parabolic SAR in Different Market Conditions
In trending markets, the Parabolic SAR is generally more reliable. The dots consistently remain below the price in uptrends and above the price in downtrends, providing clear entry and exit signals. However, in ranging markets, the Parabolic SAR can produce many false signals, leading to losses. In these conditions, combining the Parabolic SAR with other indicators, such as moving averages or oscillators, can help filter out these false signals and improve trading accuracy. Consider using a stronger filter, like a confirmation from another indicator, or waiting for a clear breakout before entering a trade.
Final Wrap-Up
Mastering the Parabolic SAR isn’t about overnight riches; it’s about building a solid understanding of its strengths and limitations. By combining the knowledge gained here – from identifying trends and generating signals to implementing effective risk management strategies – you’ll be well-equipped to approach forex trading with increased confidence and a more strategic approach. Remember, consistent practice and a disciplined approach are key to successful trading. So, dive in, learn, and start charting your path to forex success!
User Queries
What are the common mistakes traders make when using the Parabolic SAR?
Over-reliance on the Parabolic SAR without confirmation from other indicators is a major pitfall. Ignoring risk management principles and chasing quick profits can also lead to significant losses. Finally, failing to adapt the strategy to different market conditions (ranging vs. trending) can result in inaccurate signals.
Can the Parabolic SAR be used in other markets besides Forex?
Yes, the Parabolic SAR is a versatile indicator applicable to various markets, including stocks, indices, and commodities. However, the optimal settings and interpretation might need adjustments depending on the specific market’s volatility and characteristics.
How often should I adjust the acceleration factor in the Parabolic SAR?
There’s no one-size-fits-all answer. Adjusting the acceleration factor depends on market volatility and your trading style. In highly volatile markets, a lower acceleration factor might be preferable to avoid whipsaws. Experimentation and backtesting are key to finding the optimal settings for your strategy.
Obtain recommendations related to How to Use Bollinger Bands in Forex that can assist you today.
For descriptions on additional topics like How to Stay Profitable with Forex Trading in 2025, please visit the available How to Stay Profitable with Forex Trading in 2025.


