Forex trading basics? Sounds intimidating, right? Wrong! Think of it less like rocket science and more like a global marketplace buzzing with opportunities. Forex trading basics unlock the world of currency exchange, where you can potentially profit from fluctuations in the values of different currencies. We’ll demystify currency pairs, trading strategies, and risk management, showing you the ropes in a way that’s both insightful and surprisingly fun.
This guide dives into the core concepts of forex trading, covering everything from understanding currency pairs (like EUR/USD or GBP/JPY) to mastering basic trading strategies. We’ll explore the dynamic forces of supply and demand that drive currency prices, examine different market analysis techniques, and highlight the importance of risk management to protect your investments. Get ready to navigate the exciting world of global finance!
What is Forex Trading?
Forex trading, or foreign exchange trading, is essentially the buying and selling of different currencies against each other. Think of it like a global marketplace where currencies are constantly fluctuating in value based on supply and demand. Individuals and institutions participate to profit from these price movements, speculating on whether a currency will rise or fall in value relative to another. It’s a massive, decentralized market operating 24 hours a day, five days a week, making it incredibly dynamic and accessible.
Currency Pairs and Their Notation
Currency pairs are the core of forex trading. They represent the exchange rate between two currencies. The notation follows a specific format: the first currency listed is the base currency, and the second is the quote currency. For example, in the pair EUR/USD (Euro/US Dollar), the Euro is the base currency and the US Dollar is the quote currency. The exchange rate shows how many units of the quote currency are needed to buy one unit of the base currency. So, if EUR/USD is 1.10, it means one Euro can be exchanged for 1.10 US Dollars.
Examples of Currency Pairs, Forex trading basics
Forex trading involves a vast array of currency pairs, categorized into majors, minors, and exotics based on their trading volume and liquidity.
Major currency pairs are the most actively traded and involve the US dollar paired with other major global currencies. Examples include EUR/USD (Euro/US Dollar), USD/JPY (US Dollar/Japanese Yen), GBP/USD (British Pound/US Dollar), and USD/CHF (US Dollar/Swiss Franc).
Minor currency pairs involve one major currency (usually not the US dollar) and another currency. Examples include EUR/GBP (Euro/British Pound), EUR/JPY (Euro/Japanese Yen), and GBP/JPY (British Pound/Japanese Yen).
Exotic currency pairs consist of one major currency and the currency of a smaller or emerging economy. Examples include USD/MXN (US Dollar/Mexican Peso), USD/TRY (US Dollar/Turkish Lira), and EUR/CZK (Euro/Czech Koruna).
Characteristics of Different Currency Pairs
The following table compares the characteristics of major, minor, and exotic currency pairs:
| Currency Pair Type | Liquidity | Volatility | Spread | Example |
|---|---|---|---|---|
| Major | High | Moderate to High | Low | EUR/USD |
| Minor | Medium | Moderate | Medium | EUR/GBP |
| Exotic | Low | High | High | USD/MXN |
Understanding the Forex Market
The forex market, also known as the foreign exchange market, is a global decentralized marketplace where currencies are traded. Understanding its intricacies is crucial for successful trading. This section delves into the key factors influencing forex prices, the role of supply and demand, and the unique characteristics of this massive market.
Factors Influencing Forex Prices
Numerous factors impact currency values, creating a dynamic and often unpredictable environment. These factors can be broadly categorized as economic, political, and social influences. Economic factors include interest rates, inflation rates, gross domestic product (GDP) growth, and government debt levels. A country with strong economic fundamentals, for instance, high GDP growth and low inflation, generally sees its currency appreciate. Political stability and geopolitical events also play a significant role. Political instability or international conflicts can lead to significant currency fluctuations. Social factors, such as consumer confidence and market sentiment, can also influence forex prices. For example, a surge in positive news about a particular country’s economy can boost investor confidence and increase demand for its currency.
Supply and Demand in Forex Trading
Like any market, the forex market operates on the principles of supply and demand. When demand for a particular currency is high relative to its supply, its value increases (appreciation). Conversely, when supply exceeds demand, its value decreases (depreciation). This interplay of supply and demand is constantly shifting, driven by the various factors mentioned above. For example, if investors believe a country’s central bank will raise interest rates, they may increase their demand for that country’s currency, pushing its value upward. This is because higher interest rates make the currency more attractive to investors seeking higher returns.
Characteristics of the Forex Market
The forex market distinguishes itself through several key characteristics. Its 24/5 availability means trading occurs across different time zones, offering continuous opportunities. This global accessibility makes it a highly liquid market, meaning large volumes of currency are traded constantly, facilitating easy entry and exit from positions. The high liquidity ensures price transparency and relatively low transaction costs. The decentralized nature of the market, involving numerous banks, corporations, and individuals, further contributes to its robustness and resilience.
Illustrating the Global Nature of the Forex Market
Imagine a world map with interconnected lines representing the constant flow of currency transactions. Major financial centers like New York, London, Tokyo, and Sydney are highlighted as hubs, with lines radiating outwards to connect with other cities and countries. The thickness of each line could represent the volume of currency exchanged between those locations. This visualization underscores the interconnectedness and global reach of the forex market, illustrating how currencies are traded continuously across geographical boundaries and time zones. The map would dynamically change throughout the day, reflecting the ebb and flow of currency trades as markets open and close in different regions.
Basic Forex Trading Strategies
Forex trading, while potentially lucrative, demands a well-defined strategy. Choosing the right approach depends on your risk tolerance, time commitment, and trading goals. Understanding the nuances of different strategies is crucial for success in this dynamic market. Let’s delve into three common approaches: scalping, day trading, and swing trading.
Scalping, Day Trading, and Swing Trading: A Comparison
These three strategies differ significantly in their timeframe and approach. Scalping involves holding positions for mere seconds or minutes, aiming for small profits on numerous trades. Day trading, on the other hand, focuses on closing all positions before the market closes for the day. Swing trading, the longest-term of the three, holds positions for several days, weeks, or even months, capitalizing on larger price swings. The table below summarizes their key differences:
| Feature | Scalping | Day Trading | Swing Trading |
|---|---|---|---|
| Timeframe | Seconds to minutes | Within a single trading day | Days, weeks, or months |
| Profit Target | Small profits per trade, high volume | Moderate profits per trade, moderate volume | Large profits per trade, low volume |
| Risk Tolerance | High | Medium | Low |
| Technical Analysis Reliance | Very High | High | Moderate |
Technical Indicators in Forex Trading
Technical indicators provide valuable insights into market trends and momentum. They analyze price charts and volume data to identify potential trading opportunities. While numerous indicators exist, some of the most commonly used include:
- Moving Averages (MA): These smooth out price fluctuations, highlighting trends. A simple moving average (SMA) averages the closing prices over a specific period, while an exponential moving average (EMA) gives more weight to recent prices. For example, a trader might use a 50-day SMA and a 200-day SMA to identify potential buy or sell signals based on their crossover.
- Relative Strength Index (RSI): This momentum oscillator measures the magnitude of recent price changes to evaluate overbought or oversold conditions. Readings above 70 often suggest an overbought market, while readings below 30 may indicate an oversold market. A trader might use this to identify potential reversal points.
- MACD (Moving Average Convergence Divergence): This indicator uses two moving averages to identify changes in momentum. It generates buy signals when the MACD line crosses above the signal line and sell signals when it crosses below. A trader might combine this with other indicators for confirmation.
Risk Management Techniques for Each Strategy
Effective risk management is paramount in forex trading, regardless of the chosen strategy. Here’s a breakdown of risk management techniques for each:
Scalping Risk Management
- Small Position Sizes: Minimize potential losses per trade.
- Tight Stop-Losses: Quickly exit losing trades to limit damage.
- High Win Rate Focus: Aim for a high percentage of winning trades to offset losses.
- Fast Execution Speed: Minimize slippage and latency.
Day Trading Risk Management
- Defined Entry and Exit Points: Stick to a pre-determined trading plan.
- Moderate Position Sizes: Balance risk and reward.
- Stop-Loss Orders: Protect against significant losses.
- Regular Evaluation: Review performance and adjust strategy as needed.
Swing Trading Risk Management
- Larger Position Sizes (relative to scalping and day trading): Capitalize on larger price swings.
- Wider Stop-Losses: Accommodate larger price fluctuations.
- Longer Time Horizon: Allow trades to play out over an extended period.
- Diversification: Spread investments across multiple currency pairs.
Forex Trading Tools and Platforms
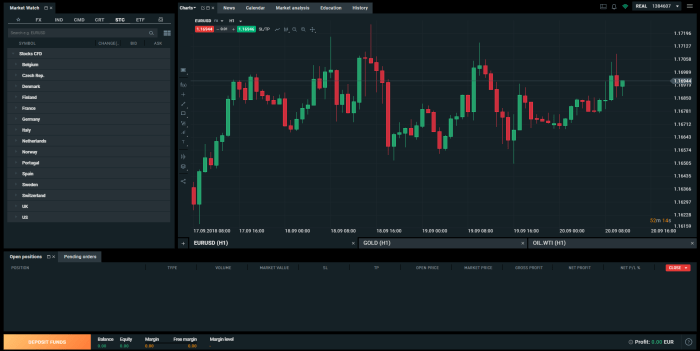
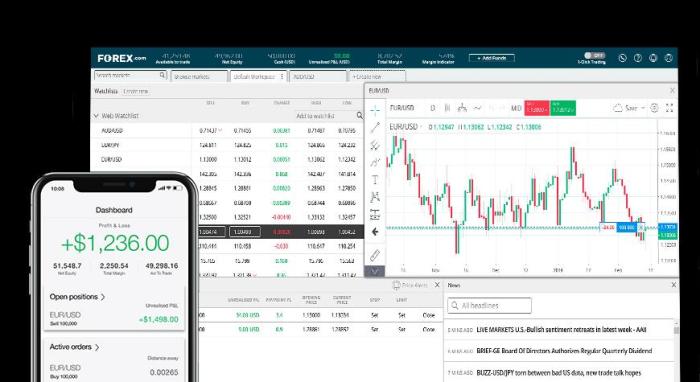
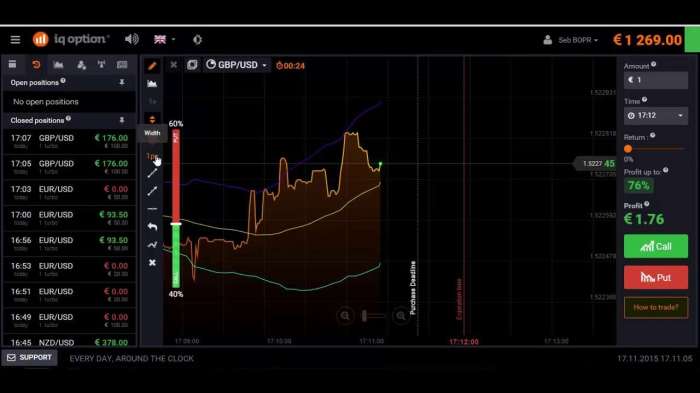
Navigating the forex market effectively requires the right tools. A forex trading platform acts as your central hub, providing access to real-time market data, charting tools, and the ability to execute trades. Choosing the right platform is crucial for a smooth and efficient trading experience.
Forex trading platforms are sophisticated software applications designed to facilitate all aspects of forex trading. They provide a centralized interface for accessing market information, analyzing price movements, placing orders, and managing your trading account. Understanding their functionality is paramount for successful trading.
Forex Trading Platform Features
A robust forex trading platform offers a range of essential features. These features streamline the trading process and empower traders to make informed decisions. Access to these features is often a key differentiator between platforms.
- Real-time Quotes and Charts: Access to live market data is fundamental. This allows traders to monitor price fluctuations and react swiftly to market changes.
- Order Placement and Management: Platforms provide tools for placing various order types (market orders, limit orders, stop-loss orders, etc.) and managing open positions.
- Technical Analysis Tools: Many platforms incorporate technical indicators (moving averages, RSI, MACD, etc.) and drawing tools to aid in chart analysis.
- Economic Calendar: An integrated economic calendar keeps traders informed of upcoming economic news releases that can significantly impact currency prices.
- Account Management: The platform allows traders to monitor their account balance, view trading history, and manage their funds.
Forex Trading Charts
Different chart types offer unique perspectives on price action, helping traders identify trends and patterns. The choice of chart type often depends on individual trading styles and preferences.
- Line Charts: These charts connect closing prices with a line, providing a simple visualization of price trends over time. They are best suited for identifying long-term trends.
- Bar Charts: Each bar represents a specific time period (e.g., one day, one hour), showing the open, high, low, and closing prices. They offer more detailed information than line charts.
- Candlestick Charts: These charts are similar to bar charts but provide a visual representation of the price range and direction within each time period, using distinct “candles” to highlight price movements. They are popular for identifying candlestick patterns.
Interpreting Candlestick Patterns
Candlestick patterns are formed by the combination of candlestick bodies and wicks (shadows). These patterns can signal potential price reversals or continuations. Recognizing these patterns can significantly improve trading decisions. For example:
- Bullish Engulfing Pattern: A long green candlestick completely engulfs a preceding smaller red candlestick, suggesting a potential bullish reversal.
- Bearish Engulfing Pattern: A long red candlestick completely engulfs a preceding smaller green candlestick, indicating a potential bearish reversal.
- Hammer: A small body with a long lower wick, suggesting potential support and a possible bullish reversal.
- Hanging Man: Similar to a hammer but appears at the top of an uptrend, suggesting potential resistance and a possible bearish reversal.
Fundamental Analysis in Forex: Forex Trading Basics

Forex trading isn’t just about charting patterns; it’s also about understanding the bigger picture. Fundamental analysis dives deep into the economic and political factors that drive currency values, providing a crucial long-term perspective for savvy traders. Ignoring these fundamentals is like navigating a ship without a map – you might get lucky, but you’re more likely to crash.
Fundamental analysis examines a country’s economic health, political stability, and global standing to predict how its currency will perform. It’s about identifying underlying trends and anticipating shifts in market sentiment, which can significantly impact currency pairs. This approach contrasts with technical analysis, which focuses solely on price charts and trading patterns. While both are valuable, a holistic strategy often incorporates both.
Macroeconomic Indicators and Currency Values
Several key macroeconomic indicators provide valuable insights into a country’s economic strength and influence its currency’s value. These indicators offer a snapshot of the economy’s health, allowing traders to anticipate potential shifts in currency prices. Strong economic indicators often lead to increased demand for a country’s currency, pushing its value higher. Conversely, weak indicators can signal a weakening currency.
Geopolitical Events and Their Impact
Geopolitical events can dramatically shift currency values, often causing short-term volatility. Unexpected political changes, international conflicts, and even shifts in global alliances can trigger significant market reactions. Traders need to be aware of these events and understand their potential impact on currency pairs. For instance, a sudden political upheaval in a major economy can trigger a rapid devaluation of its currency as investors seek safer havens.
Key Economic Indicators and Their Impact on Currency Pairs
| Indicator | Description | Impact on Currency | Example |
|---|---|---|---|
| Interest Rates | The rate at which a central bank lends money to commercial banks. | Higher rates attract foreign investment, strengthening the currency. Lower rates can weaken it. | A rate hike by the US Federal Reserve typically strengthens the USD against other currencies. |
| Inflation Rate | The rate at which the general level of prices for goods and services is rising. | High inflation erodes purchasing power, weakening the currency. Low and stable inflation is generally positive. | High inflation in Argentina has historically led to a weakening of the Argentine Peso. |
| GDP Growth | The total value of goods and services produced within a country’s borders. | Strong GDP growth usually strengthens the currency, indicating a healthy economy. | Periods of strong GDP growth in China have often led to appreciation of the Chinese Yuan. |
| Unemployment Rate | The percentage of the labor force that is unemployed and actively seeking work. | Low unemployment generally indicates a strong economy, supporting the currency. High unemployment can weaken it. | Low unemployment in Germany often strengthens the Euro. |
Technical Analysis in Forex
Technical analysis is a powerful tool for forex traders, focusing on past price action and market trends to predict future price movements. Unlike fundamental analysis, which examines economic indicators and news events, technical analysis relies solely on chart patterns and indicators to identify potential trading opportunities. It’s about spotting patterns and trends to make informed trading decisions.
Support and Resistance Levels
Support and resistance levels are crucial concepts in technical analysis. Support levels represent price points where buying pressure is expected to overcome selling pressure, preventing further price declines. Conversely, resistance levels represent price points where selling pressure is anticipated to outweigh buying pressure, halting upward price movements. These levels are often identified by horizontal lines drawn on a price chart, marking previous price highs (resistance) and lows (support). A break above resistance often signals a bullish trend, while a break below support can indicate a bearish trend. For example, if a currency pair consistently finds support at 1.1000, traders might anticipate a bounce from that level. Conversely, if it repeatedly fails to break through resistance at 1.1200, traders might anticipate a price reversal.
Common Technical Indicators
Several technical indicators help traders analyze price trends and momentum. These tools process price data to generate signals that can be used in conjunction with other forms of analysis.
- Moving Averages: Moving averages smooth out price fluctuations, revealing underlying trends. A simple moving average (SMA) calculates the average price over a specific period, while an exponential moving average (EMA) gives more weight to recent prices. A bullish crossover occurs when a shorter-term moving average crosses above a longer-term moving average, suggesting a potential uptrend. A bearish crossover happens when the opposite occurs. For instance, a 50-day SMA crossing above a 200-day SMA could signal a long-term bullish trend.
- Relative Strength Index (RSI): The RSI measures the magnitude of recent price changes to evaluate overbought or oversold conditions. Readings above 70 generally suggest an overbought market (potential for a price correction), while readings below 30 indicate an oversold market (potential for a price rebound). A divergence between the RSI and price action can also provide valuable insights. For example, if the price makes a new high, but the RSI fails to make a new high, it could be a bearish divergence suggesting a potential price reversal.
- Moving Average Convergence Divergence (MACD): The MACD is a trend-following momentum indicator that shows the relationship between two moving averages. It consists of a MACD line and a signal line. Buy signals are often generated when the MACD line crosses above the signal line, while sell signals are generated when the MACD line crosses below the signal line. A histogram accompanying the lines visually represents the difference between the two moving averages, adding another layer of interpretation. For example, a bullish crossover accompanied by a rising histogram could strengthen the buy signal.
Combining Technical Indicators for Trading Signals
Using a combination of indicators can provide more robust trading signals. For example, a trader might use a combination of moving averages (to identify trend), RSI (to gauge momentum and overbought/oversold conditions), and MACD (to confirm trend changes) to make more informed trading decisions. A bullish signal might involve a bullish crossover of moving averages, an RSI reading below 30, and a bullish MACD crossover. Conversely, a bearish signal might involve a bearish crossover of moving averages, an RSI reading above 70, and a bearish MACD crossover. It’s crucial to remember that no indicator is foolproof, and false signals can occur. Therefore, risk management and proper position sizing are essential.
Risk Management in Forex Trading
Forex trading, while potentially lucrative, is inherently risky. Ignoring risk management is like sailing a yacht without a map or compass – you might get lucky, but you’re far more likely to end up shipwrecked. Effective risk management isn’t about avoiding losses entirely; it’s about controlling them and ensuring your trading journey remains sustainable. It’s about protecting your capital and allowing you to participate in the market for the long haul.
Position Sizing
Position sizing determines how much capital you allocate to each trade. It’s crucial because it directly impacts your potential profit and, more importantly, your potential loss. A common approach is to risk a fixed percentage of your trading capital on any single trade – typically between 1% and 5%. For example, if your trading account has $10,000 and you risk 2%, your maximum loss per trade would be $200. This method helps to prevent catastrophic losses that could wipe out your account. Calculating position size involves considering your stop-loss order (discussed below) and the pip value of your trading instrument. Overly aggressive position sizing, driven by greed or a lack of understanding, is a major contributor to trader failure.
Stop-Loss and Take-Profit Orders
Stop-loss and take-profit orders are essential risk management tools. A stop-loss order automatically closes your position when the price moves against you by a predetermined amount, limiting your potential losses. A take-profit order automatically closes your position when the price moves in your favor by a predetermined amount, securing your profits. These orders are crucial because they allow you to manage your trades objectively, without the emotional biases that can lead to poor decision-making. For instance, a trader might set a stop-loss at 50 pips below their entry price to limit potential losses to 50 pips and a take-profit at 100 pips above their entry price to secure a 100 pip profit. The ratio between stop-loss and take-profit is often considered, with a risk-reward ratio of 1:2 or 1:3 being common targets.
Best Practices for Risk Management
Proper risk management involves a multifaceted approach. A well-defined strategy is crucial to success.
- Never risk more than a small percentage of your trading capital on any single trade. This cushions you against significant losses and ensures long-term survival.
- Always use stop-loss orders. This prevents emotional trading and protects your capital from unforeseen market movements.
- Set realistic profit targets. Greed can lead to poor decisions; focus on consistent, small gains rather than chasing unrealistic home runs.
- Diversify your portfolio. Don’t put all your eggs in one basket. Spread your trades across different currency pairs to reduce your overall risk.
- Keep a trading journal. Track your trades, wins, and losses. This provides valuable insights into your performance and helps you identify areas for improvement.
- Regularly review and adjust your risk management strategy. Market conditions change; your strategy needs to adapt to remain effective.
- Backtest your trading strategies. Before risking real money, test your strategies on historical data to assess their potential performance and risk profile. This can significantly reduce the likelihood of encountering unexpected losses.
- Develop a robust trading plan. This should include your risk tolerance, position sizing strategy, entry and exit rules, and a clear definition of your trading goals.
- Stay disciplined. Stick to your trading plan, even when things get tough. Emotional decision-making is a common pitfall for traders.
Demo Accounts and Practice
Before diving headfirst into the thrilling (and sometimes terrifying) world of live forex trading, mastering the art of the trade through practice is crucial. Think of it like learning to drive – you wouldn’t jump straight into rush hour traffic without a few lessons in the parking lot first, right? Demo accounts offer that safe, controlled environment to hone your skills and develop winning strategies without risking your hard-earned cash.
Demo accounts mirror the live forex market, providing you with virtual funds to trade with. This allows you to experiment with different strategies, test your risk management techniques, and get comfortable with the trading platform before committing real money. Understanding how to use a demo account effectively is a critical stepping stone to successful forex trading.
Setting Up a Demo Account
Setting up a demo account is usually a straightforward process. Most forex brokers offer them for free. Typically, you’ll need to create an account with the broker, often requiring basic personal information such as your name, email address, and potentially a phone number. After verifying your account (which might involve an email confirmation), you can then choose to open a demo account. The broker will usually provide you with a predetermined amount of virtual currency to start trading. Remember to check the specific requirements and steps on your chosen broker’s website, as they may vary slightly.
Effective Practice Trading Techniques
Effective practice isn’t just about randomly placing trades. It’s about developing a structured approach to learning and refining your trading skills. One effective method is to focus on a single strategy at a time, mastering its nuances before moving on to another. Keep a detailed trading journal, noting your trades, the rationale behind them, and the outcomes. This will help you identify patterns in your successes and failures, allowing for continuous improvement. Additionally, practice managing your risk effectively by setting stop-loss orders and sticking to a pre-defined risk tolerance. Don’t be afraid to make mistakes; they’re valuable learning opportunities. The key is to learn from them and adapt your strategy accordingly.
Forex Trading Learning Resources
Numerous resources are available to enhance your forex trading knowledge. These include:
- Online Courses: Many reputable online platforms offer comprehensive forex trading courses, ranging from beginner to advanced levels. These courses often include video tutorials, practice exercises, and community forums.
- Trading Books: Numerous books delve into various aspects of forex trading, covering technical and fundamental analysis, risk management, and trading psychology.
- Broker Educational Materials: Many forex brokers provide educational resources to their clients, including webinars, tutorials, and market analysis.
- Forex Forums and Communities: Engaging with other traders in online forums and communities can provide valuable insights, support, and alternative perspectives.
Remember that consistent practice and continuous learning are key to success in forex trading. Don’t rush the process; take your time to understand the market and develop your skills before venturing into live trading.
Ending Remarks
So, you’ve taken your first steps into the world of forex trading basics. Remember, consistent learning and responsible risk management are key. While the potential for profit is exciting, the forex market demands respect. By understanding the fundamentals, employing smart strategies, and practicing diligently, you can build a solid foundation for your trading journey. Now go forth and conquer the currency markets!
Discover more by delving into trading cfd forex further.
Further details about forex trading api is accessible to provide you additional insights.
