Understanding Forex Trading Volatility: Think of the forex market as a rollercoaster – sometimes a gentle climb, other times a heart-stopping plunge. This wild ride is driven by volatility, the measure of price fluctuations. From geopolitical events to economic news, understanding what whipsaws the market is key to navigating its unpredictable nature and potentially profiting from its ups and downs. This guide breaks down everything you need to know to tame the beast.
We’ll delve into defining forex volatility, exploring different types and how to measure it. Discover how volatility impacts various trading strategies, from scalping to swing trading, and learn crucial risk management techniques to protect your capital. We’ll also equip you with the knowledge to interpret volatility indicators like the Average True Range (ATR) and Bollinger Bands, and how to use them to your advantage. Finally, we’ll examine how economic events and central bank policies influence volatility and offer strategies for managing risk in this dynamic market.
Defining Forex Volatility
Forex volatility refers to the rate at which the price of a currency pair fluctuates. A highly volatile currency pair experiences significant price swings in a short period, while a less volatile pair shows smaller, more gradual movements. Understanding volatility is crucial for forex traders because it directly impacts potential profits and losses. High volatility offers opportunities for substantial gains, but also carries a higher risk of significant losses. Conversely, low volatility presents smaller profit potential but also minimizes risk.
Factors Influencing Forex Volatility
Numerous factors contribute to the volatility observed in the forex market. These factors can be broadly categorized as economic, political, and geopolitical events. Economic data releases, such as employment figures, inflation rates, and interest rate decisions, often trigger significant price movements. Unexpected economic news, whether positive or negative, can drastically increase volatility. Political instability within a country, changes in government, or major policy shifts can also dramatically impact the value of its currency. Geopolitical events, such as wars, trade disputes, and natural disasters, can create significant uncertainty and lead to heightened volatility across the market. Furthermore, market sentiment and speculation play a crucial role; periods of high uncertainty or fear often result in increased volatility.
Types of Volatility
Forex volatility can be categorized into historical and implied volatility. Historical volatility measures the actual price fluctuations of a currency pair over a specific past period, typically calculated using standard deviation. It provides a backward-looking perspective on price movement. Implied volatility, on the other hand, is a forward-looking measure derived from the prices of options contracts on a currency pair. It reflects market expectations of future price fluctuations. Implied volatility is often higher than historical volatility, as it incorporates market participants’ assessment of risk and uncertainty.
Methods for Measuring Forex Volatility
Several methods exist for measuring forex volatility. The most common is calculating the standard deviation of price changes over a defined period. This involves determining the average price change and then calculating how much individual price changes deviate from that average. Another common method uses the average true range (ATR), which considers the high-low range and the previous day’s closing price to capture price fluctuations more comprehensively. Volatility can also be measured using the Bollinger Bands indicator, which plots bands around a moving average to visually represent price volatility. The wider the bands, the higher the volatility.
High and Low Volatility Currency Pairs
The volatility of a currency pair is influenced by various factors related to the underlying economies and their political landscapes. Some pairs consistently exhibit higher volatility than others.
| Currency Pair | Average Daily Range (Pips) | Typical Volatility | Factors Influencing Volatility |
|---|---|---|---|
| USD/JPY | 80-120 | Moderate to High | Interest rate differentials, economic data releases from US and Japan, global risk sentiment |
| EUR/USD | 70-100 | Moderate | Economic data releases from Eurozone and US, political developments in Europe, global market sentiment |
| GBP/USD | 90-130 | Moderate to High | Brexit-related news, UK economic data, global risk sentiment |
| USD/CHF | 60-90 | Low to Moderate | Safe-haven status of the Swiss Franc, interest rate differentials, global risk sentiment |
Impact of Volatility on Trading Strategies

Forex volatility, that thrilling rollercoaster of price swings, significantly impacts trading strategies. Understanding how different trading styles react to these fluctuations is crucial for consistent profitability. Ignoring volatility can lead to significant losses, while leveraging it can unlock substantial gains. This section explores how volatility affects various trading approaches and Artikels strategies to navigate these turbulent waters.
Volatility’s Influence on Different Trading Styles
High volatility presents both opportunities and challenges for traders. Scalpers, who aim for small profits from quick trades, thrive in volatile markets, as frequent price movements provide ample opportunities. However, the rapid shifts also increase the risk of significant losses if not managed carefully. Day traders, holding positions for a single day, face similar complexities. While volatile markets offer more potential for profit, they demand constant vigilance and precise execution. Swing traders, holding positions for several days or weeks, might find high volatility challenging, as large price swings can quickly erase profits or trigger stop-losses. They need robust risk management and a clear understanding of market trends to weather the storm. Conversely, low volatility can make it harder for all these styles to find profitable trades.
Risk Management Techniques for Volatile Markets
Effective risk management is paramount during periods of high volatility. A crucial element is using stop-loss orders to limit potential losses. These orders automatically sell a position when it reaches a predetermined price, preventing catastrophic losses from large, unexpected price movements. Another key strategy is position sizing. Traders should reduce their position size in volatile markets to limit exposure to risk. Diversification across different currency pairs can also help mitigate risk, reducing the impact of a single pair’s volatility. Finally, thorough research and understanding of market fundamentals are crucial to making informed trading decisions.
Sample Trading Plan for High Volatility Environments, Understanding Forex Trading Volatility
A sample trading plan designed for high volatility might include:
- Strict Stop-Loss Orders: Setting stop-losses at a level that limits potential losses to a pre-defined percentage of the account balance (e.g., 1-2%).
- Reduced Position Sizing: Trading smaller position sizes than usual to minimize risk. For example, if a trader normally risks 1% per trade, they might reduce this to 0.5% during high volatility.
- Focus on Shorter Timeframes: For scalpers and day traders, focusing on shorter timeframes might be more appropriate to capitalize on smaller, frequent price movements.
- Increased Monitoring: More frequent monitoring of positions and market conditions is necessary to react quickly to changing circumstances.
- Clear Exit Strategy: Having a clear plan for exiting trades, regardless of profit or loss, helps prevent emotional decision-making.
Risk-Reward Ratios in High vs. Low Volatility
The risk-reward ratio, a fundamental concept in trading, is significantly affected by market volatility. In high volatility, the potential for both profits and losses increases. Traders might aim for a higher risk-reward ratio (e.g., 1:2 or even higher) to compensate for the increased risk. This means aiming for a profit target twice as large as the potential loss. However, achieving this higher ratio consistently is more challenging due to the unpredictable nature of the market. In low volatility environments, the risk-reward ratio might be more conservative (e.g., 1:1 or even 1:1.5), as the potential profit is smaller. However, the lower risk makes achieving this ratio more consistent.
Pitfalls of Ignoring Volatility in Trading Decisions
Ignoring volatility in trading decisions can lead to several pitfalls. One major risk is experiencing unexpected and significant losses. Large price swings can quickly wipe out trading accounts if proper risk management isn’t in place. Another pitfall is the potential for missed opportunities. High volatility can create lucrative trading opportunities, but traders unaware of the dynamics might miss out on these profitable situations. Furthermore, neglecting volatility can lead to poor decision-making, as traders might misinterpret market signals and make incorrect trading choices. Ultimately, ignoring volatility can significantly reduce profitability and increase the chances of substantial losses.
Analyzing Volatility Indicators
Navigating the forex market successfully often hinges on understanding and reacting to volatility. While price action provides a crucial visual cue, volatility indicators offer a quantifiable measure, helping traders anticipate market swings and refine their strategies. These indicators aren’t crystal balls, but they can significantly improve your odds.
Average True Range (ATR) Indicator
The Average True Range (ATR) is a popular volatility indicator that measures the average range of price movement over a specified period. It essentially tells you how much the price is fluctuating on average. A higher ATR suggests higher volatility, indicating potentially larger price swings and increased risk, while a lower ATR suggests lower volatility and potentially smaller price movements. The ATR is calculated using the True Range (TR), which is the greatest of the following three values: the current high minus the current low, the absolute value of the current high minus the previous close, and the absolute value of the current low minus the previous close. The ATR is then a moving average of the TR, typically a 14-period simple moving average. This means it smooths out the daily fluctuations in volatility, giving a more stable reading. For example, an ATR of 50 pips suggests significantly higher volatility than an ATR of 10 pips.
Other Volatility Indicators
Several other indicators offer valuable insights into forex market volatility.
Bollinger Bands
Bollinger Bands are plotted as three lines: a simple moving average (typically 20-period) and two standard deviation bands above and below the moving average. Wider bands suggest higher volatility, while narrower bands suggest lower volatility. When the price touches the upper band, it might signal an overbought condition, potentially leading to a price reversal. Conversely, a touch of the lower band might indicate an oversold condition.
Relative Strength Index (RSI)
While primarily a momentum indicator, the RSI can also provide insights into volatility. Extreme RSI readings (above 70 or below 30) often coincide with periods of high volatility, suggesting potential reversals or increased price swings.
Interpreting Volatility Indicators with Price Action
Volatility indicators are most effective when used in conjunction with price action analysis. For instance, a high ATR reading might signal increased volatility, but the price action itself will dictate the direction of the move. A rising price accompanied by a high ATR suggests a strong uptrend with potential for significant gains, but also a higher risk of sharp reversals. Conversely, a falling price with a high ATR indicates a strong downtrend with the same potential for significant losses and sharp reversals. Essentially, volatility indicators quantify the potential for price movement, while price action reveals the direction.
Strategies for Identifying Trading Opportunities Using Volatility Indicators
Volatility indicators can help identify potential trading opportunities in several ways. For example, a period of low volatility (narrow Bollinger Bands, low ATR) might precede a breakout, creating an opportunity for traders to enter a position as the price moves beyond the established range. Conversely, high volatility periods (wide Bollinger Bands, high ATR) can be used to identify potential reversal points based on overbought/oversold conditions indicated by RSI or price action reaching the Bollinger Band extremes.
Incorporating Volatility Indicators into a Trading Strategy: A Step-by-Step Guide
- Choose your indicators: Select one or more volatility indicators (ATR, Bollinger Bands, RSI) that align with your trading style and risk tolerance.
- Set your parameters: Define the period for your indicators (e.g., 14-period ATR, 20-period Bollinger Bands). Experiment to find parameters that suit the timeframe and asset you are trading.
- Analyze price action: Observe the price chart and identify trends, support and resistance levels, and candlestick patterns.
- Interpret indicator signals: Analyze the chosen indicators in conjunction with price action. For instance, a high ATR combined with a strong uptrend might suggest a continuation of the uptrend, while a high ATR combined with a price rejection at resistance might signal a potential reversal.
- Develop a trading plan: Define your entry and exit points, stop-loss and take-profit levels, based on the combined signals from price action and volatility indicators.
- Backtest your strategy: Test your strategy on historical data to assess its effectiveness and refine your approach.
- Risk management: Always employ appropriate risk management techniques, such as position sizing and stop-loss orders, to protect your capital.
Volatility and Economic Events
Forex volatility doesn’t exist in a vacuum; it’s heavily influenced by the ebb and flow of global economic events. Understanding this relationship is crucial for navigating the forex market successfully. Major news announcements, central bank decisions, and even unexpected geopolitical shifts can dramatically impact currency values and create significant trading opportunities – or pitfalls.
Impact of Major Economic News Announcements
The release of key economic data, such as employment figures, inflation rates, and GDP growth reports, often triggers sharp and immediate movements in currency pairs. These announcements can significantly alter market sentiment, leading to rapid price swings. For example, a stronger-than-expected jobs report might boost a country’s currency as it signals economic strength, while disappointing inflation data could weaken it. The speed and magnitude of these reactions depend on the market’s expectation versus the actual result; a surprising outcome will generally lead to a more volatile response. Traders often anticipate these events and adjust their positions accordingly, leading to increased trading volume and price volatility around the announcement time.
Anticipating Periods of Increased Volatility Using Economic Calendars
Economic calendars are invaluable tools for forex traders. These calendars list upcoming economic announcements, providing traders with a heads-up on potential volatility spikes. By reviewing the calendar, traders can identify periods of heightened risk and adjust their trading strategies accordingly. For instance, the release of the US Non-Farm Payroll report is widely known to cause significant volatility in USD-related pairs. Knowing this, traders can choose to reduce their exposure or even take advantage of the anticipated volatility through specific trading strategies like scalping or swing trading, depending on their risk tolerance and trading style.
Central Bank Policies and Currency Fluctuations
Central banks play a pivotal role in influencing currency values through monetary policy decisions. Interest rate changes, quantitative easing (QE) programs, and forward guidance statements all have a significant impact on currency strength. For example, a central bank raising interest rates typically strengthens its currency as higher rates attract foreign investment seeking higher returns. Conversely, a surprise rate cut could weaken the currency as investors seek higher yields elsewhere. The communication surrounding these decisions is also crucial; clear and consistent communication can reduce volatility, while unexpected shifts in policy can trigger sharp market reactions.
Comparative Effects of Economic News on Currency Pairs
Different types of economic news affect currency pairs differently. For example, US employment data will likely have a greater impact on USD-related pairs (e.g., EUR/USD, GBP/USD, USD/JPY) than on pairs that don’t involve the US dollar (e.g., EUR/JPY). Similarly, data related to the Eurozone will disproportionately affect the EUR, impacting pairs like EUR/USD and EUR/GBP. The specific impact also depends on the context; a positive US jobs report might strengthen the USD against the JPY but might have a weaker impact against the EUR if the Eurozone’s economic outlook is also strong.
Typical Volatility Response of Currency Pairs to Economic Events
| Economic Event | Currency Pair | Expected Volatility Increase | Example |
|---|---|---|---|
| US Non-Farm Payroll | EUR/USD | High | Significant price swings immediately following the release. |
| Eurozone CPI | EUR/GBP | Medium | Noticeable price fluctuations, potentially lasting several hours. |
| Bank of Japan Interest Rate Decision | USD/JPY | High | Sharp price movements depending on the decision and market expectations. |
| UK GDP Growth | GBP/USD | Medium to High | Price changes influenced by the growth rate and market reaction. |
Managing Volatility Risk
Forex trading, while potentially lucrative, is inherently risky, especially due to volatility. Successfully navigating the forex market requires a robust strategy for managing this inherent risk, minimizing potential losses while maximizing profit opportunities. Understanding and implementing effective volatility risk management techniques is crucial for long-term success.
Hedging Against Volatility Risk
Several methods exist to mitigate the impact of volatility on your trading positions. These methods aim to reduce the potential for significant losses by offsetting risks. Effective hedging often involves using financial instruments that move inversely to your primary forex positions.
Using Options and Futures Contracts for Volatility Management
Options contracts provide the right, but not the obligation, to buy or sell a currency pair at a specific price (strike price) on or before a certain date (expiration date). This allows traders to define their maximum risk and potentially profit from volatility without directly holding the underlying asset. For example, a trader anticipating increased volatility in EUR/USD might buy put options, protecting against a decline in the EUR. Futures contracts, on the other hand, obligate both parties to buy or sell a currency pair at a predetermined price on a specific future date. They offer a more direct way to hedge against price movements but involve a higher degree of commitment. A trader could use a short EUR/USD futures contract to hedge against potential gains in a long EUR/USD position in their portfolio. The choice between options and futures depends on the trader’s risk tolerance and market outlook.
Position Sizing in Volatile Markets
Appropriate position sizing is paramount in volatile markets. This involves determining the optimal amount of capital to allocate to each trade to limit potential losses. A common approach is to risk only a small percentage (e.g., 1-2%) of your trading capital on any single trade. This risk management strategy helps prevent significant drawdowns during periods of high volatility. For instance, if a trader has a $10,000 account and risks 1%, their maximum loss per trade would be $100. This ensures that even a series of losing trades would not wipe out their entire account.
Stop-Loss Orders and Volatility Management
Stop-loss orders are crucial for managing volatility risk. These orders automatically close a position when the price reaches a predetermined level, limiting potential losses. They act as a safety net, preventing significant losses during sudden market swings. For example, a trader might place a stop-loss order at a level below their entry price, ensuring their position is closed if the price falls below their risk tolerance. The placement of stop-loss orders should consider the volatility of the market and the trader’s risk appetite. A tighter stop-loss order limits losses but increases the chance of the position being prematurely closed, while a wider stop-loss order offers greater protection but allows for larger potential losses.
Technical Analysis for Identifying Potential Turning Points
Technical analysis tools can help identify potential turning points in volatile trends. Indicators like moving averages, relative strength index (RSI), and Bollinger Bands can provide signals of potential reversals or breakouts. For example, a bearish divergence between price and RSI might suggest a potential price reversal. Similarly, a price breakout above the upper Bollinger Band could indicate a strong upward trend. However, it’s crucial to remember that technical analysis is not foolproof and should be used in conjunction with other risk management strategies.
Volatility and Technical Analysis: Understanding Forex Trading Volatility
Forex trading, even with its inherent unpredictability, isn’t a game of pure chance. Technical analysis provides a framework for understanding and potentially profiting from market volatility. By recognizing patterns and using specific indicators, traders can anticipate shifts in price action and adjust their strategies accordingly. This section delves into how technical analysis tools can help navigate the turbulent waters of volatile forex markets.
Technical indicators offer valuable insights into market volatility, helping traders anticipate periods of heightened or reduced price swings. Understanding how these indicators behave in different volatility environments is crucial for effective risk management and strategy optimization. Furthermore, candlestick patterns, often overlooked, can reveal subtle clues about the underlying market sentiment and volatility. Support and resistance levels, fundamental to technical analysis, also react differently in volatile versus stable markets, offering further opportunities for astute traders.
Identifying Volatile Periods with Technical Indicators
The Average True Range (ATR) is a widely used indicator that measures market volatility directly. A rising ATR suggests increasing volatility, while a falling ATR indicates decreasing volatility. The Bollinger Bands, another popular tool, depict price volatility through the widening and narrowing of the bands. Wide bands suggest high volatility, while narrow bands suggest low volatility. By monitoring these indicators, traders can gain a clearer picture of the current market environment and adjust their position sizing and risk management strategies accordingly. For instance, a trader might reduce position size during periods of high ATR values to limit potential losses.
Candlestick Patterns and Volatility
Candlestick patterns provide visual representations of price action over specific time periods. Certain patterns are strongly associated with increased volatility. For example, a large engulfing candle, where one candle completely encompasses the previous one, often signals a significant shift in momentum and potentially increased volatility. Similarly, doji candles, characterized by a small body and long wicks, can indicate indecision in the market and precede periods of increased volatility as the market attempts to find direction. Analyzing candlestick patterns in conjunction with other indicators can offer a more comprehensive view of the market’s volatility and potential price movements.
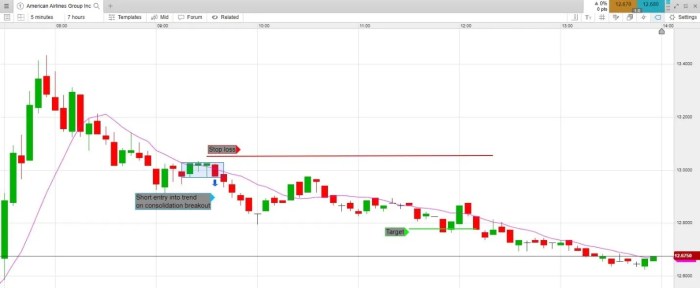
Support and Resistance in Volatile Markets
Support and resistance levels represent price points where buying or selling pressure is expected to be particularly strong. In volatile markets, these levels can be breached more frequently. However, even in highly volatile environments, support and resistance levels still play a crucial role. A strong breakout above a significant resistance level, for instance, often signals a sustained upward trend, even if the market remains volatile. Conversely, a failure to break through a resistance level despite strong upward momentum could suggest a weakening of the bullish trend. Traders often use these breakouts and breakdowns to time their entries and exits.
Effectiveness of Technical Indicators Across Volatility Environments
The effectiveness of various technical indicators can vary significantly depending on the level of market volatility. Moving averages, for example, tend to lag behind price movements more in volatile markets, making them less reliable for short-term trading decisions. Conversely, oscillators like the Relative Strength Index (RSI) can be more useful in identifying overbought or oversold conditions, even in volatile markets, although their signals might require more careful interpretation. Traders should carefully evaluate the suitability of different indicators based on the specific market conditions and their trading style.
Identifying a Breakout Using the Bollinger Bands
Imagine a chart showing the price of a currency pair. The Bollinger Bands are plotted around the price, with the bands widening significantly, indicating a period of high volatility. Suddenly, the price breaks decisively above the upper Bollinger Band. This breakout, visualized as a sustained move above the upper band, often signals a strong bullish trend and potentially significant price appreciation. The widening bands themselves highlighted the elevated volatility, making the breakout signal even more significant. This clear break above the established range suggests a shift in market sentiment and could provide a strong entry point for a long position. The trader would need to confirm this with other indicators and risk management techniques.
Last Recap
Mastering forex trading isn’t just about predicting price movements; it’s about understanding and managing volatility. By grasping the factors influencing volatility, utilizing appropriate indicators, and implementing robust risk management strategies, you can significantly improve your trading outcomes. Remember, forex trading is a high-risk endeavor, but with knowledge and discipline, you can navigate the volatility and potentially achieve success. So, buckle up and prepare to ride the waves!
FAQ Section
What are some common mistakes traders make when dealing with volatility?
Ignoring volatility altogether, overtrading during high-volatility periods, and failing to adjust position sizing based on market conditions are common pitfalls.
How often should I review my trading plan in a volatile market?
Regularly, even daily, especially during periods of high volatility. Market conditions change rapidly, requiring adjustments to your strategy.
Can I use volatility indicators alone to make trading decisions?
No. Volatility indicators should be used in conjunction with other technical analysis tools and a solid understanding of fundamental market factors for informed decisions.
What are some alternative ways to manage volatility risk besides options and futures?
Diversification across currency pairs, reducing position sizes, and employing strict stop-loss orders are effective strategies.
Learn about more about the process of How to Avoid Overtrading in Forex in the field.
Explore the different advantages of Can You Make Money with Forex Trading? The Truth Revealed that can change the way you view this issue.


