How to Use the Parabolic SAR in Forex Trading? Unlocking the secrets of this powerful indicator isn’t about rocket science; it’s about understanding its nuances and how to harness its potential for profitable trades. We’ll delve into the mechanics of the Parabolic SAR, exploring its settings, signal generation, and risk management strategies. Get ready to level up your forex game!
This guide will walk you through everything from the basics – understanding the Parabolic SAR’s visual representation on a chart and its core settings – to advanced techniques, such as combining it with other indicators for enhanced accuracy. We’ll cover common pitfalls and misconceptions, ensuring you avoid costly mistakes. Prepare for a deep dive into maximizing your trading potential with the Parabolic SAR.
Introduction to Parabolic SAR

The Parabolic SAR, or Stop and Reverse, is a technical indicator that helps traders identify potential trend reversals in the forex market. It’s a fascinating tool because it’s essentially a trailing stop-loss that dynamically adjusts to the price action, aiming to stay just behind the price movement within a trend. Think of it as a little digital assistant constantly whispering, “This trend might be ending soon!” – but you still need to make the final call.
This indicator’s primary purpose is to pinpoint potential entry and exit points, helping traders capitalize on ongoing trends while minimizing potential losses. It does this by placing a “stop” point behind the price, suggesting that if the price crosses this point, the trend might be reversing. By carefully observing the SAR’s behavior, traders can attempt to identify shifts in market momentum.
Parabolic SAR Visual Description
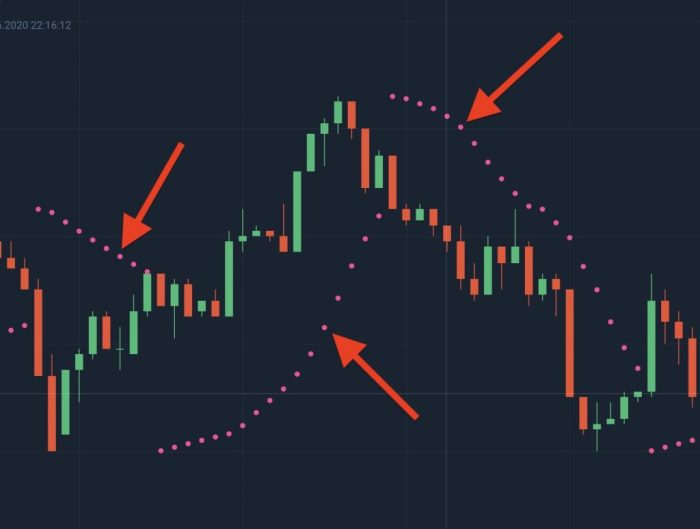
Imagine a series of dots appearing on your forex chart. These dots represent the Parabolic SAR. They’re positioned either above or below the price candles, depending on the prevailing trend. During an uptrend, the dots sit below the price candles, acting as a potential stop-loss. As the price moves higher, the dots “trail” behind it, getting progressively closer. Conversely, in a downtrend, the dots appear above the price candles, again trailing the price movement. The distance between the dots and the price candles is what’s called the “acceleration factor,” which increases as the trend progresses, making the SAR more aggressive. When the price breaks through the SAR, it suggests a potential trend reversal, signaling a potential entry point for a trade in the opposite direction. The dots themselves visually represent the indicator’s dynamic nature, constantly adapting to the price action.
Parabolic SAR Compared to Other Indicators
Understanding how the Parabolic SAR fits into your overall trading strategy often involves comparing it to other popular indicators. Below is a table comparing it to Moving Averages and MACD:
| Indicator | Purpose | Method | Strengths |
|---|---|---|---|
| Parabolic SAR | Identify trend reversals and potential entry/exit points. | Trailing stop-loss that dynamically adjusts based on price action and an acceleration factor. | Simple to understand and use, visually clear, adaptable to various timeframes. |
| Moving Averages (e.g., 20-day MA) | Identify trend direction and potential support/resistance levels. | Calculates the average price over a specific period. | Smooths out price fluctuations, provides a clear trend indication. |
| MACD (Moving Average Convergence Divergence) | Identify momentum shifts and potential trend reversals. | Compares two moving averages to generate a signal line. | Provides insights into momentum changes, can signal potential buy/sell opportunities. |
Understanding Parabolic SAR Settings
The Parabolic SAR, while seemingly simple, offers a surprising degree of customization through its two key settings: the Acceleration Factor and the Maximum Value. Mastering these settings is crucial for optimizing the indicator’s performance and adapting it to your specific trading style and market conditions. Understanding how these parameters influence signal generation is key to consistently profitable trading.
The Acceleration Factor and Maximum Value directly impact the indicator’s sensitivity and the frequency of generated signals. A deeper understanding of their interplay allows for fine-tuning the Parabolic SAR to suit different trading strategies and market volatility levels. Incorrect settings can lead to whipsaws and missed opportunities, highlighting the importance of careful consideration and experimentation.
Acceleration Factor’s Influence on Signal Generation
The Acceleration Factor determines how quickly the SAR accelerates towards the price. A lower acceleration factor results in a slower, more gradual adjustment of the SAR, producing fewer, potentially more reliable signals. Conversely, a higher acceleration factor leads to faster adjustments, resulting in more frequent signals, some of which might be false signals. This parameter essentially controls the sensitivity of the indicator. Think of it as the “aggressiveness” of the SAR’s pursuit of the price. A smaller acceleration factor (e.g., 0.01) leads to a smoother, less reactive SAR, while a larger factor (e.g., 0.2) makes it much more responsive to price changes.
Maximum Value’s Role in Limiting SAR Movement
The Maximum Value setting acts as a cap on the Acceleration Factor. It prevents the Acceleration Factor from exceeding a predefined limit, thus limiting the SAR’s speed of adjustment. This is a crucial safeguard against overly aggressive and potentially unreliable signals, especially in highly volatile markets. Without a Maximum Value, the Acceleration Factor could theoretically increase indefinitely, leading to excessively frequent and unreliable reversals. This setting provides a much-needed control mechanism, enhancing the indicator’s robustness and reducing the risk of false signals caused by rapid price fluctuations.
Impact of Different Settings on Signal Generation, How to Use the Parabolic SAR in Forex Trading
The following table illustrates the effects of varying Acceleration Factor and Maximum Value settings on signal generation. Remember that these are illustrative examples and the actual results can vary depending on the specific market conditions and asset being traded.
| Acceleration Factor | Maximum Value | Signal Generation Frequency | Signal Reliability | Suitable Market Conditions | Example Scenario |
|---|---|---|---|---|---|
| 0.01 | 0.2 | Low | High | Low Volatility | Slow, steady trend with infrequent reversals. The SAR would lag behind price, providing clear entry and exit signals. |
| 0.02 | 0.2 | Medium | Medium | Medium Volatility | More frequent price swings. The SAR would follow price more closely, offering more trading opportunities, but with a higher chance of false signals. |
| 0.1 | 0.2 | High | Low | High Volatility | Rapid and frequent price changes. The SAR would closely track price movements, generating numerous signals, many of which might be false breakouts. |
Generating Buy and Sell Signals

The Parabolic SAR isn’t a standalone indicator; its power lies in its ability to generate buy and sell signals that, when combined with price action and other indicators, provide a more robust trading strategy. Understanding how to interpret these signals is crucial for successful forex trading using this tool. Essentially, the SAR acts as a trailing stop-loss, dynamically adjusting to price movements.
The Parabolic SAR generates signals based on its position relative to the price. When the SAR is below the price, it suggests an uptrend, while a SAR above the price indicates a downtrend. Crossing points, where the SAR moves from one side of the price to the other, signal potential trade reversals. However, remember that confirmation from other indicators is always recommended.
Buy Signals
A buy signal is generated when the price moves above the Parabolic SAR. This suggests a potential upward trend reversal. Ideally, you’d want to see confirmation of this signal through other technical indicators or through a clear bullish price action pattern, such as a bullish engulfing candle or a breakout from a resistance level. Relying solely on the SAR crossing can lead to false signals. For example, imagine a situation where the price briefly crosses above the SAR during a period of sideways consolidation. This wouldn’t necessarily signal a strong buy opportunity. Instead, wait for a confirmation signal. A confirmation could be the price breaking above a significant resistance level, supported by increasing trading volume.
Sell Signals
Conversely, a sell signal is triggered when the price moves below the Parabolic SAR. This indicates a potential downward trend reversal. Similar to buy signals, confirming the sell signal with other indicators or price action is essential to avoid premature entries. A strong sell signal might involve the price breaking below a key support level, accompanied by a bearish candlestick pattern and declining trading volume. For instance, observe a scenario where the price falls below the SAR, followed by a bearish engulfing candle, breaking through a significant support level with decreasing volume. This could suggest a strong bearish momentum and a confirmation of the sell signal.
Interpreting the Parabolic SAR with Other Indicators
The Parabolic SAR’s effectiveness is amplified when used in conjunction with other technical indicators. Combining it with moving averages, for instance, can provide stronger confirmation. A buy signal from the Parabolic SAR could be validated if the price also crosses above a short-term moving average, indicating a shift in momentum. Similarly, a sell signal could be confirmed by a price crossing below a short-term moving average. Using the Relative Strength Index (RSI) alongside the Parabolic SAR can help identify overbought and oversold conditions, further filtering potential trade entries. For example, a buy signal from the Parabolic SAR accompanied by an RSI reading below 30 might suggest a strong buy opportunity. Conversely, a sell signal from the Parabolic SAR and an RSI reading above 70 might indicate a strong sell opportunity. Remember that each market and asset class may respond differently.
Risk Management with Parabolic SAR
The Parabolic SAR, while a powerful trend-following indicator, doesn’t guarantee profits. Effective risk management is crucial to protect your capital and ensure long-term success in forex trading using this tool. Ignoring risk management can quickly lead to significant losses, even with accurate signals. Therefore, integrating robust risk management strategies is paramount.
Stop-loss orders are your safety net when using the Parabolic SAR. They automatically exit a trade when the price reaches a predetermined level, limiting potential losses. Without them, a sudden market reversal can wipe out your account balance. Proper stop-loss placement is a critical skill for any trader, regardless of the indicator used, but it’s particularly important with the Parabolic SAR because its trailing nature can sometimes lead to whipsaws.
Stop-Loss Order Placement Strategies
Several strategies can help determine appropriate stop-loss placement. A common approach is to place your stop-loss just beyond the most recent swing low (for long positions) or swing high (for short positions). This aims to capture the majority of the profitable move while minimizing losses during temporary price fluctuations. Another strategy involves setting the stop-loss a fixed number of pips or a percentage of your entry price away from your entry point. This provides a consistent risk level across different trades. The choice depends on your risk tolerance and trading style. For instance, a conservative trader might prefer a tighter stop-loss, while a more aggressive trader might accept a wider one. Remember, the goal is to balance risk and reward.
Position Sizing and Risk Per Trade
Determining appropriate position size is critical for managing risk. A common method is to risk a fixed percentage of your trading account on each trade, regardless of the expected profit. For example, risking 1% to 2% per trade is a widely accepted guideline. This means that if your stop-loss is 50 pips away from your entry point, and you have a $10,000 account, you would only risk $50-$100 on that trade. This strategy ensures that a series of losing trades won’t decimate your trading account. Adjusting your position size based on the volatility of the currency pair is also essential. More volatile pairs require smaller position sizes to maintain the same risk level. For example, trading a highly volatile pair like GBP/JPY might necessitate a smaller position size compared to a less volatile pair like EUR/USD, even if your stop-loss remains the same.
Common Mistakes and Misconceptions
The Parabolic SAR, while a seemingly simple indicator, can lead to significant losses if misused. Many traders fall into common traps, misinterpreting its signals or relying on it too heavily, ultimately undermining their trading strategy. Understanding these pitfalls is crucial for successfully integrating the Parabolic SAR into your forex trading arsenal.
Many traders treat the Parabolic SAR as a standalone trading system, ignoring other crucial aspects of market analysis. This over-reliance can lead to whipsaws, especially in choppy or ranging markets where the SAR can generate frequent, unreliable signals. Furthermore, failing to consider factors like support and resistance levels, overall market sentiment, and economic news can significantly reduce the accuracy of the SAR’s signals and increase the risk of losing trades.
Ignoring Market Context
The Parabolic SAR thrives in trending markets. Its effectiveness diminishes significantly in sideways or ranging markets. In these conditions, the SAR can generate a series of false signals, leading to frequent entries and exits with minimal profit or substantial losses. A trader solely relying on the Parabolic SAR in a ranging market might experience a continuous string of losing trades as the price fluctuates within a defined range, triggering the SAR to flip back and forth between buy and sell signals. For example, imagine a currency pair trading within a tight range of 1.1000 to 1.1050 for several days. The Parabolic SAR might repeatedly signal a buy near 1.1000 and a sell near 1.1050, leading to many small losses as the price remains within the range. A more holistic approach incorporating other indicators or analysis methods would be necessary in such a situation.
Over-Optimization of the Acceleration Factor
The acceleration factor is a crucial parameter that controls the sensitivity of the Parabolic SAR. While adjusting this factor can improve the indicator’s performance in specific scenarios, over-optimizing it based on past data can lead to significant issues. Over-optimization essentially creates a system that performs well in historical data but fails miserably in live trading. This is because the market conditions that led to successful optimization are unlikely to persist. A trader might find a specific acceleration factor that yielded excellent results in a past period of strong trending markets, but this factor might produce poor results in a less volatile or less directional market.
Failing to Incorporate Risk Management
Even with accurate signals, effective risk management is paramount. Ignoring proper stop-loss orders and position sizing can amplify losses, even when the Parabolic SAR correctly identifies the trend. For instance, a trader might enter a long position based on a SAR signal, but without a predetermined stop-loss, a sudden price reversal could wipe out their entire account. A well-defined risk management strategy, including stop-loss orders and position sizing based on account equity, is essential to mitigate potential losses and protect capital. This is especially crucial when using the Parabolic SAR, as its signals can be frequent, and a series of incorrect signals can rapidly deplete trading capital.
Advanced Parabolic SAR Strategies
Mastering the Parabolic SAR is one thing; truly leveraging its power requires combining it with other technical analysis tools for enhanced accuracy and risk management. By integrating the SAR’s dynamic stop-loss functionality with other indicators, traders can refine their entry and exit points, significantly improving their trading performance. This section explores several advanced strategies that demonstrate this synergistic approach.
The Parabolic SAR, while effective on its own, can benefit significantly from confirmation signals provided by other indicators. This reduces the risk of false signals and helps identify stronger trends, leading to more confident trading decisions. Understanding how to combine the SAR with other indicators allows traders to capitalize on market momentum while minimizing potential losses.
Investigate the pros of accepting The Benefits of Forex Trading Signals in your business strategies.
Combining Parabolic SAR with RSI
The Relative Strength Index (RSI) is a momentum oscillator that helps identify overbought and oversold conditions. Combining the Parabolic SAR with the RSI provides a powerful confirmation system. A bullish SAR signal confirmed by an RSI above 50 suggests a strong upward trend, while a bearish SAR signal coupled with an RSI below 50 suggests a strong downward trend. Conversely, divergence between the SAR and RSI can signal potential trend reversals. For example, a rising SAR despite a falling RSI could indicate weakening bullish momentum, suggesting a potential sell opportunity.
Using this combination, traders can wait for both the SAR and the RSI to align before entering a trade, thus filtering out potentially false signals. This increases the probability of successful trades by focusing on higher-confidence setups.
Discover the crucial elements that make Best forex brokers with low spreads and commissions? the top choice.
Combining Parabolic SAR with Support and Resistance Levels
Support and resistance levels represent price areas where the market has historically shown difficulty breaking through. Combining the Parabolic SAR with these levels provides a robust strategy. A bullish SAR signal breaking above a significant resistance level, coupled with strong buying volume, confirms a strong breakout and signals a long position. Conversely, a bearish SAR signal breaking below a significant support level, with strong selling volume, signals a short position.
This approach helps traders identify high-probability trading opportunities by capitalizing on established market price dynamics. By waiting for the SAR to confirm a breakout, traders can significantly reduce the risk of entering trades in weak or uncertain market conditions.
Example Advanced Strategies
Here are some examples of advanced strategies incorporating the Parabolic SAR:
- Strategy 1: SAR and RSI Confirmation: Enter a long position when the Parabolic SAR turns upward and the RSI is above 50. Exit the position when the Parabolic SAR turns downward or the RSI falls below 30.
- Strategy 2: SAR and Support/Resistance Breakout: Enter a long position when the Parabolic SAR breaks above a significant resistance level with increased volume. Exit the position when the Parabolic SAR turns downward or the price falls back below the resistance level.
- Strategy 3: SAR and Moving Average Crossover: Enter a long position when the Parabolic SAR turns upward and a short-term moving average crosses above a long-term moving average. Exit the position when the Parabolic SAR turns downward or the short-term moving average crosses below the long-term moving average.
Step-by-Step Guide: Implementing a SAR and RSI Strategy
- Identify the asset: Choose a Forex pair you want to trade.
- Apply indicators: Add the Parabolic SAR and RSI indicators to your chart. A typical RSI setting is 14 periods.
- Identify potential long entries: Look for instances where the Parabolic SAR flips upward (from below the price to above) and the RSI is above 50. This indicates a potential bullish trend.
- Place your trade: Enter a long position once both conditions are met. Use a stop-loss order below the recent swing low.
- Manage your trade: Let the Parabolic SAR act as your trailing stop-loss. The SAR will dynamically adjust your stop-loss as the price moves in your favor.
- Identify potential exits: Exit your long position when either the Parabolic SAR flips downward or the RSI falls below 30. Alternatively, you may set a take-profit target based on your risk-reward ratio.
Remember: Always use proper risk management techniques, including setting stop-loss and take-profit orders, regardless of the strategy used. Past performance is not indicative of future results. Backtest any strategy thoroughly before implementing it with real capital.
Illustrative Examples
Let’s dive into real-world scenarios to see the Parabolic SAR in action. Understanding how it performs in both profitable and unprofitable trades is crucial for effective application. We’ll examine two distinct examples, highlighting the entry and exit strategies, and analyzing the factors that contributed to the outcome.
Profitable EUR/USD Trade
Imagine a scenario where the EUR/USD pair is trending upwards. The Parabolic SAR, initially below the price, acts as a trailing stop. As the price continues its ascent, the SAR gradually moves upwards, following the price action. Our visual representation would show a steadily rising EUR/USD price line, with the Parabolic SAR dots trailing behind, always below the candles. Let’s say we enter a long position when the price breaks above a significant resistance level, with the SAR confirming the bullish momentum. The SAR continues to trail the price, providing a dynamic stop-loss. We exit the trade when the price experiences a temporary pullback, and the SAR crosses above the price, generating a sell signal. This would be depicted on our imaginary chart as the SAR dots moving above the candle’s closing price. The resulting profit is realized due to the upward trend and the effective use of the Parabolic SAR as a trailing stop, minimizing potential losses during the price correction. This example illustrates how the Parabolic SAR can enhance risk management in a trending market. The key here is the confirmation of the trend and the use of the SAR as a dynamic stop loss, rather than a fixed one.
Unprofitable GBP/JPY Trade
Now, let’s consider a scenario where the GBP/JPY pair exhibits a choppy, sideways movement, lacking a clear trend. Our hypothetical chart would show a price oscillating within a defined range. We enter a long position based on a perceived upward breakout, with the Parabolic SAR initially below the price. However, the price fails to sustain the upward momentum and reverses sharply downwards. The SAR, which is trailing the price, rapidly catches up and crosses above the price, triggering a sell signal. Unfortunately, this sell signal occurs at a lower price than our entry point, resulting in a loss. In this case, the Parabolic SAR, while functioning correctly, failed to accurately predict the price reversal in a range-bound market. The lesson learned here is that the Parabolic SAR is best suited for trending markets and should be used cautiously in sideways or highly volatile conditions. Over-reliance on the Parabolic SAR in the absence of other confirming indicators can lead to losses, as demonstrated in this example. Diversification of trading strategies and incorporating other technical analysis tools can mitigate this risk.
Final Thoughts
Mastering the Parabolic SAR in forex trading isn’t a get-rich-quick scheme, but a strategic tool demanding discipline and understanding. By grasping the principles Artikeld here – from interpreting signals to managing risk effectively – you’ll be well-equipped to navigate the complexities of the forex market. Remember, consistent practice and a keen eye for market dynamics are your ultimate allies. So, sharpen your skills, refine your strategy, and conquer the forex world!
Commonly Asked Questions: How To Use The Parabolic SAR In Forex Trading
Can I use the Parabolic SAR on all timeframes?
Yes, but its effectiveness can vary. Shorter timeframes might produce more frequent, potentially noisy signals, while longer timeframes offer smoother trends but fewer trading opportunities.
How do I avoid whipsaws with the Parabolic SAR?
Combining the Parabolic SAR with other confirmation indicators (like RSI or price action) reduces the risk of false signals and whipsaws. Also, consider using tighter stop-losses in volatile markets.
Is the Parabolic SAR suitable for all market conditions?
No, it performs best in trending markets. In ranging markets, its signals can be unreliable, leading to frequent losses. Consider using other indicators in sideways markets.
What’s the best acceleration factor setting?
There’s no one-size-fits-all answer. Experimentation is key. Start with the default setting (0.02) and adjust based on your trading style and market conditions. A higher acceleration factor makes the indicator more sensitive.


