Forex Trading View: Dive into the thrilling world of currency trading! This isn’t your grandpa’s stock market; it’s a 24/7 global arena where fortunes are made and lost with the blink of an eye. We’ll unravel the mysteries of charting, indicators, and risk management, transforming you from a curious observer into a confident trader. Prepare for a wild ride.
We’ll explore the key platforms, comparing their user interfaces and features, helping you choose the perfect tool for your trading style. From candlestick patterns to fundamental analysis, we’ll equip you with the knowledge to decipher market movements and build winning strategies. Get ready to master the art of forex trading.
Understanding Forex Trading View Platforms
Navigating the world of forex trading requires the right tools. A robust trading view platform is essential for success, providing the data, analysis capabilities, and order execution needed to make informed decisions. Choosing the right platform, however, can be daunting given the sheer number of options available. This section explores the core functionalities of popular platforms, compares their interfaces, and highlights the key differences between beginner-friendly and professional-grade tools.
Core Functionalities of Forex Trading View Platforms
Forex trading view platforms offer a range of core functionalities designed to streamline the trading process. These typically include real-time price quotes, charting tools with various technical indicators, order placement and management features, news feeds, and economic calendars. Many platforms also integrate with automated trading systems (Expert Advisors or EAs) and provide backtesting capabilities to evaluate trading strategies. The level of sophistication of these features, however, varies considerably across different platforms. Advanced platforms often include features like sentiment analysis, heatmaps, and sophisticated order types not found in more basic platforms.
Comparison of User Interfaces Across Different Platforms
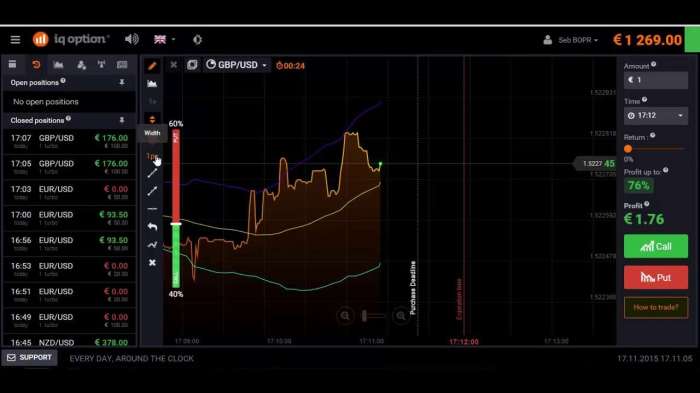
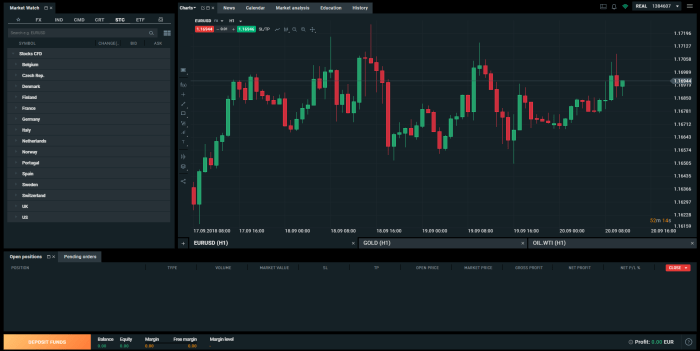
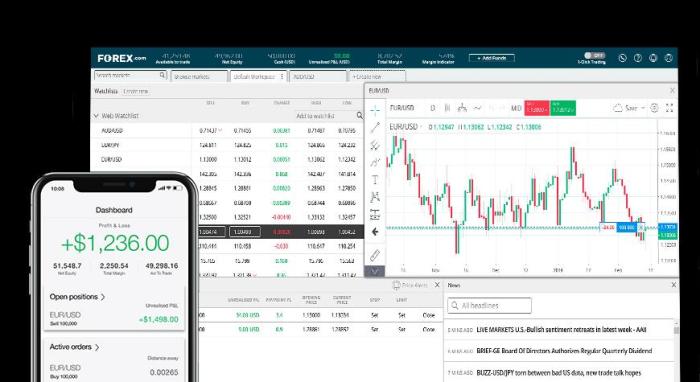
Three popular platforms illustrate the diversity in user interface design: MetaTrader 4 (MT4), MetaTrader 5 (MT5), and TradingView. MT4 and MT5, developed by MetaQuotes Software Corp., share a similar layout but MT5 boasts a more modern interface with enhanced charting capabilities and a broader range of order types. Both are known for their customizability, allowing traders to arrange windows and indicators to suit their preferences. TradingView, on the other hand, prioritizes a clean, intuitive design with a strong focus on charting and technical analysis. While less customizable than MT4/MT5 in terms of window arrangement, TradingView excels in its ease of use and extensive charting tools. The difference boils down to personal preference: MT4/MT5 offer greater customization for experienced traders, while TradingView’s streamlined approach is ideal for beginners.
Key Features Differentiating Professional and Beginner-Friendly Platforms
Professional-grade platforms generally offer a wider array of features and tools compared to beginner-friendly options. Advanced order types (like OCO orders or trailing stops), automated trading capabilities, advanced charting tools (including multiple timeframes and customizable studies), and in-depth market analysis tools are hallmarks of professional platforms. Beginner-friendly platforms typically focus on simplicity and ease of use, often prioritizing a clean interface and basic charting tools. They may lack advanced order types and automated trading functionalities but are perfectly suitable for those learning the ropes. The key difference lies in the depth and complexity of features, reflecting the needs and experience levels of different traders.
Platform Comparison Table
The following table compares three platforms based on pricing, charting tools, and available indicators. Note that pricing models can vary depending on account type and features subscribed to.
| Platform | Pricing | Charting Tools | Indicators |
|---|---|---|---|
| MetaTrader 4 (MT4) | Typically free, brokerage fees may apply | Wide range of chart types, customizable timeframes, drawing tools | Hundreds of built-in and custom indicators |
| MetaTrader 5 (MT5) | Typically free, brokerage fees may apply | Similar to MT4, with enhanced features and more chart types | Similar to MT4, with expanded library |
| TradingView | Free plan with limited features, paid plans available with increased functionality | Extensive charting tools, advanced drawing tools, multiple timeframes | Vast library of built-in and custom indicators, including Pine Script for creating custom indicators |
Charting Techniques and Indicators in Forex Trading View
Unlocking the secrets of the forex market requires more than just gut feeling; it demands a keen eye for patterns and the ability to interpret market signals. This is where charting techniques and indicators become your invaluable allies, transforming raw data into actionable insights. By mastering these tools within the Forex Trading View platform, you’ll gain a significant edge in navigating the dynamic world of currency trading.
Chart Types in Forex Trading View
Forex Trading View offers various chart types, each providing a unique perspective on price movements. The choice of chart type depends on your trading style and the specific information you’re seeking. Candlestick charts, bar charts, and line charts are the most common. Candlestick charts visually represent price action over a specific period, showing the open, high, low, and close prices. Bar charts present similar information but use vertical bars instead of candles. Line charts simply connect closing prices, highlighting the overall trend. Understanding the nuances of each chart type is crucial for effective analysis. For example, candlestick patterns offer insights into market sentiment that are not readily apparent in bar or line charts.
Technical Indicators in Forex Trading View
Technical indicators are mathematical calculations applied to price data, providing additional context for interpreting charts. They help identify potential entry and exit points, confirm trends, and gauge market momentum. Among the most popular are the Relative Strength Index (RSI), the Moving Average Convergence Divergence (MACD), and various moving averages. The RSI measures the magnitude of recent price changes to evaluate overbought or oversold conditions, typically ranging from 0 to 100. An RSI above 70 often suggests an overbought market, while below 30 indicates an oversold market. The MACD identifies changes in momentum by comparing two moving averages, often signaling potential trend reversals. Moving averages smooth out price fluctuations, helping to identify trends. Simple moving averages (SMA) average prices over a specific period, while exponential moving averages (EMA) give more weight to recent prices.
Interpreting Candlestick Patterns
Candlestick patterns are visual representations of price action that can reveal insights into market sentiment and potential future price movements. For example, a bullish engulfing pattern occurs when a large green candle completely engulfs a previous red candle, suggesting a potential upward trend reversal. Conversely, a bearish engulfing pattern, where a large red candle engulfs a previous green candle, suggests a potential downward trend reversal. A hammer candlestick, characterized by a small body and a long lower wick, often indicates a potential bullish reversal at the bottom of a downtrend. A hanging man, which is similar to a hammer but appears at the top of an uptrend, suggests a potential bearish reversal. Mastering candlestick pattern recognition is a key skill for any successful forex trader.
Example Trading Setup Using Three Indicators
Imagine a EUR/USD chart displaying a clear uptrend. We’ll use three indicators to confirm this trend and identify a potential entry point. First, a 20-period exponential moving average (EMA) is sloping upwards, reinforcing the uptrend. Second, the RSI is above 50 but below 70, indicating bullish momentum without being overbought. Third, the MACD line is above its signal line, further confirming the bullish trend. This combination suggests a strong uptrend, and a trader might consider a long position (buying EUR/USD) near the 20-EMA, with a stop-loss order placed below a recent swing low and a take-profit order placed at a predetermined resistance level. The visual representation would show the upward-sloping 20-EMA, the RSI in the bullish zone but not overbought, and the MACD line above its signal line, all pointing towards a positive outlook for EUR/USD. The trader would then monitor the price action and indicator readings for confirmation of their trading setup.
Fundamental Analysis within the Forex Trading View Context
Forex trading isn’t just about charting patterns; understanding the underlying economic forces driving currency movements is crucial for long-term success. Fundamental analysis provides this crucial context, allowing traders to anticipate shifts in currency values based on economic news, policy changes, and key indicators. By combining technical analysis with a strong fundamental understanding, traders can significantly improve their decision-making process and risk management.
Fundamental analysis examines macroeconomic factors influencing currency values. These factors range from government policies and central bank decisions to major economic releases and global events. Understanding these influences is key to making informed trading decisions and navigating the complexities of the forex market.
Economic News and Events Influence on Forex Price Movements
Major economic announcements, geopolitical events, and even unexpected natural disasters can dramatically impact currency pairs. For example, a surprise interest rate hike by a central bank will often cause that country’s currency to appreciate as investors seek higher returns. Conversely, a negative economic report, like a significant drop in GDP, might lead to a currency depreciation as investors lose confidence in the economy. The speed and magnitude of these price movements often depend on the market’s expectation of the event – a widely anticipated event may have a smaller impact than an unexpected one. Consider the impact of the 2008 global financial crisis; the uncertainty and economic downturn led to significant volatility across all currency pairs.
Central Bank Policies and Their Impact on Currency Pairs
Central banks wield immense power over their respective currencies. Their monetary policies, particularly interest rate decisions, directly influence a currency’s value. A higher interest rate generally attracts foreign investment, increasing demand for the currency and strengthening its value. Conversely, lower interest rates can weaken a currency as investors seek higher returns elsewhere. The actions of the Federal Reserve (the US central bank), the European Central Bank (ECB), and the Bank of Japan (BOJ), for example, have profound global implications and are closely watched by forex traders. The unexpected shift in monetary policy by the Swiss National Bank in 2015, abandoning its peg to the euro, serves as a stark reminder of the significant impact central bank decisions can have on the market.
Key Economic Indicators and Their Relevance to Forex Trading Decisions
Several key economic indicators provide valuable insights into a country’s economic health and can influence currency valuations.
Inflation, measured by indices like the Consumer Price Index (CPI), reflects the rate at which prices for goods and services are rising. High inflation can erode purchasing power and often leads to a weakening currency. Conversely, low and stable inflation is generally viewed positively.
Gross Domestic Product (GDP) represents the total value of goods and services produced within a country’s borders. Strong GDP growth typically indicates a healthy economy and can strengthen a country’s currency. Conversely, weak or negative GDP growth can signal economic trouble and weaken the currency.
Unemployment rates indicate the percentage of the labor force that is unemployed. Low unemployment generally suggests a strong economy and can support a currency’s value, while high unemployment rates can signal economic weakness.
These indicators, along with others such as trade balances, manufacturing PMI, and consumer confidence indices, paint a comprehensive picture of a nation’s economic standing, influencing currency values and providing forex traders with valuable signals.
Hypothetical Fundamental Analysis Trading Strategy
This strategy focuses on the USD/JPY pair.
Entry Point: If the US Federal Reserve announces a surprise interest rate hike, while simultaneously, data shows Japan’s GDP growth slowing and inflation remaining low, a long position in USD/JPY would be considered. The expectation is that the higher US interest rates will attract investment into the US dollar, increasing its value relative to the Japanese yen, which is weakened by the negative economic indicators.
Exit Point: The trade would be closed if either (a) the USD/JPY reaches a pre-determined profit target, or (b) new economic data emerges that suggests a shift in the fundamental outlook, such as a surprise interest rate cut by the Federal Reserve or unexpectedly strong Japanese economic data. Stop-loss orders would be implemented to limit potential losses if the market moves against the trader’s position. This strategy highlights the importance of continuously monitoring economic news and adjusting trading positions based on new information.
Risk Management Strategies on Forex Trading View Platforms
Navigating the forex market successfully isn’t just about identifying profitable trades; it’s about safeguarding your capital. Risk management is paramount, and Forex Trading View platforms offer tools to help you implement effective strategies. Understanding and employing these strategies can significantly impact your trading longevity and profitability.
Position Sizing
Position sizing determines the amount of capital you allocate to each trade. It’s crucial for limiting potential losses. A common approach is to risk a fixed percentage of your account balance on any single trade – typically 1% to 2%. For example, with a $10,000 account and a 1% risk tolerance, your maximum loss per trade should be $100. This percentage should remain consistent regardless of the trade’s perceived potential profit. This disciplined approach prevents a single losing trade from significantly impacting your overall account balance. Calculating your position size involves considering your stop-loss order (discussed below) and the pip value of your chosen currency pair.
Stop-Loss Orders
Stop-loss orders automatically close a trade when the price reaches a predetermined level, limiting potential losses. There are several types:
- Guaranteed Stop-Loss Orders: These orders guarantee execution at the specified price, but often come with a higher commission.
- Market Stop-Loss Orders: These orders are executed at the next available market price, which might be slightly worse than the specified price, especially during periods of high volatility.
- Trailing Stop-Loss Orders: These orders follow the price as it moves in your favor, locking in profits while minimizing potential losses if the price reverses. The trailing stop adjusts automatically, following the price movement by a specified number of pips.
Choosing the right stop-loss order depends on your trading style and risk tolerance. For example, a scalper might prefer a market stop-loss order for its speed, while a swing trader might use a trailing stop-loss order to protect profits during longer-term price movements.
Take-Profit Levels
Take-profit orders automatically close a trade when the price reaches a predetermined profit target. Determining appropriate take-profit levels requires analyzing chart patterns, support and resistance levels, and considering the overall market context. For example, a trader might set a take-profit level at a key resistance level, aiming to capture profits before a potential price reversal. Alternatively, a trader could use Fibonacci retracement levels to identify potential take-profit points. The key is to balance the potential for profit with the risk of the trade. Setting overly ambitious take-profit levels can lead to missed opportunities, while setting them too conservatively can limit potential gains.
Leverage Management
Leverage magnifies both profits and losses. While it can amplify gains, irresponsible leverage can lead to rapid account depletion. Forex Trading View platforms allow you to adjust your leverage settings. It’s crucial to use leverage cautiously, understanding that a small market movement can result in significant losses when high leverage is employed. Beginners are generally advised to start with low leverage (e.g., 1:10 or 1:20) to gain experience and build confidence before gradually increasing it. For instance, a trader using 1:10 leverage on a $1,000 trade will only need $100 in margin, but a loss of 10% would wipe out their entire investment. Careful consideration of your risk tolerance and the volatility of the market is essential when determining appropriate leverage levels.
Backtesting and Strategy Optimization using Forex Trading View Data

Backtesting is the secret weapon of successful Forex traders. It allows you to test your trading strategies against historical data, revealing their strengths and weaknesses before risking real money. This process is crucial for refining your approach and maximizing profitability. Think of it as a virtual trading simulator, letting you learn from past mistakes without the sting of actual losses.
The process involves feeding your trading strategy – including entry and exit rules, stop-loss and take-profit levels – into a platform like TradingView, which then applies it to historical price data. The platform then generates performance statistics, allowing you to objectively assess your strategy’s viability.
Obtain direct knowledge about the efficiency of forex trading indicators through case studies.
Backtesting Process using Historical Data
Backtesting on TradingView typically involves importing historical price data for your chosen currency pairs. You then define your trading strategy’s parameters within the platform’s strategy tester or by using custom indicators and scripts. The platform automatically executes your strategy on the historical data, generating a detailed performance report. This report includes trade details, profit/loss for each trade, and overall performance metrics. Remember, the accuracy of your backtest depends heavily on the quality and completeness of your historical data.
Performance Metrics for Backtested Strategies
Several key metrics help evaluate a backtested strategy’s performance. Win rate represents the percentage of profitable trades. While a high win rate is desirable, it’s not the sole indicator of success. A strategy with a low win rate but high average profit per trade can still be profitable overall. The Sharpe ratio measures risk-adjusted return, indicating how much excess return you receive for each unit of risk taken. A higher Sharpe ratio suggests better risk-adjusted performance. Other crucial metrics include maximum drawdown (the largest peak-to-trough decline during the backtesting period), average trade duration, and the Calmar ratio (similar to the Sharpe ratio, but focusing on maximum drawdown instead of standard deviation).
Strategy Optimization Techniques
Optimizing a strategy based on backtesting results involves systematically adjusting its parameters to improve its performance. This could involve tweaking stop-loss and take-profit levels, modifying entry and exit rules, or adjusting indicator settings. However, it’s crucial to avoid over-optimization, which occurs when you tailor your strategy so closely to the historical data that it performs poorly on new data. Robust strategies should perform consistently well across different datasets. Techniques like walk-forward analysis (testing your optimized strategy on a separate, out-of-sample dataset) are essential to mitigate over-optimization.
Performance Comparison of Three Trading Strategies
The table below illustrates the performance metrics of three distinct trading strategies (Strategy A, Strategy B, and Strategy C) backtested using the same historical EUR/USD data from January 1, 2022, to December 31, 2022.
| Metric | Strategy A | Strategy B | Strategy C |
|---|---|---|---|
| Total Net Profit | $1500 | $2000 | $1000 |
| Win Rate | 60% | 55% | 70% |
| Sharpe Ratio | 1.2 | 1.5 | 0.8 |
| Maximum Drawdown | -$500 | -$700 | -$300 |
Common Mistakes and Pitfalls in Forex Trading View Interpretation
Forex trading, while potentially lucrative, is fraught with pitfalls. Many traders, even experienced ones, fall prey to common mistakes that significantly impact their profitability. Understanding these errors and developing strategies to avoid them is crucial for long-term success. This section highlights some of the most prevalent issues and offers practical advice on mitigating their effects.
The allure of quick riches often blinds traders to the inherent risks in forex. This can lead to impulsive decisions, ignoring fundamental analysis and proper risk management. Overconfidence, fueled by initial successes, can be just as damaging as a lack of confidence. Let’s explore these common traps and how to navigate them effectively.
Confirmation Bias and Emotional Trading
Confirmation bias, the tendency to seek out information confirming pre-existing beliefs, is a major obstacle. Traders might focus solely on indicators supporting their desired trade direction, ignoring contradictory signals. This leads to poorly informed decisions and increased risk. Emotional trading, driven by fear and greed, exacerbates this issue. A string of losses can lead to panic selling, while a winning streak can encourage over-leveraging and reckless trades. Maintaining emotional discipline is paramount. Developing a trading plan and sticking to it, regardless of emotional impulses, is key to mitigating these biases.
Over-Reliance on Single Indicators or Strategies
No single indicator or strategy guarantees consistent profits. Forex markets are complex and influenced by numerous factors. Relying solely on one indicator, such as the RSI or MACD, ignores the broader market context and can lead to inaccurate predictions. Similarly, over-reliance on a single trading strategy, without adapting to changing market conditions, is a recipe for disaster. A diversified approach, incorporating multiple indicators and strategies, offers a more robust and adaptable trading system. For instance, combining technical analysis with fundamental analysis provides a more holistic view of the market.
Ignoring Risk Management Principles, Forex trading view
Effective risk management is not just about setting stop-losses; it’s a holistic approach to protecting capital. Many traders underestimate the importance of position sizing, neglecting to allocate capital appropriately based on their risk tolerance. Failing to diversify across currency pairs also concentrates risk, potentially leading to significant losses from a single unfavorable trade. Furthermore, neglecting to regularly review and adjust risk parameters based on market conditions can expose traders to unnecessary risk.
The Importance of a Trading Plan and Discipline
A well-defined trading plan serves as a roadmap, guiding decisions and minimizing emotional influences. This plan should include clear entry and exit strategies, risk management rules, and position sizing guidelines. Sticking to the plan, even during periods of losses, is crucial for consistent performance. Discipline in executing the trading plan and avoiding impulsive trades based on short-term market fluctuations is essential for long-term success. Regularly reviewing and adapting the plan based on performance and market changes further enhances its effectiveness.
Strategies to Avoid Common Pitfalls
The following strategies help mitigate common forex trading mistakes:
- Develop a comprehensive trading plan encompassing entry and exit strategies, risk management rules, and position sizing guidelines.
- Diversify your trading strategies, using a combination of technical and fundamental analysis, and multiple indicators.
- Employ robust risk management techniques, including stop-losses, take-profit orders, and appropriate position sizing.
- Maintain a trading journal to track performance, identify biases, and refine strategies.
- Practice emotional discipline by avoiding impulsive trades driven by fear or greed. Stick to your trading plan.
- Regularly review and adjust your trading plan based on market conditions and performance.
- Continuously learn and adapt your approach through education and experience.
- Seek feedback from experienced traders or mentors.
Summary
So, there you have it – a glimpse into the exciting, yet challenging, world of forex trading. Remember, success isn’t just about understanding charts and indicators; it’s about mastering your emotions, managing risk effectively, and constantly learning and adapting. The forex market is a dynamic beast, but with the right knowledge and discipline, you can tame it. Now go forth and conquer!
You also can understand valuable knowledge by exploring free forex trading signals daily.


