Forex trading data analysis: It’s not just about charts and graphs, folks. It’s about unlocking the secrets hidden within the chaotic dance of global currencies. This deep dive explores how to harness the power of data – from price action and economic indicators to news sentiment – to make smarter, more informed trading decisions. We’ll uncover the tools and techniques that separate the seasoned traders from the weekend warriors, showing you how to transform raw data into profitable opportunities.
We’ll cover everything from the basics of technical and fundamental analysis to advanced concepts like algorithmic trading and risk management. Get ready to level up your forex game with data-driven strategies that can give you a significant edge in this exciting, yet volatile, market.
Introduction to Forex Trading Data
Forex trading, or foreign exchange trading, is the global marketplace where currencies are bought and sold. It’s a massive, decentralized market operating 24/5, offering traders the chance to profit from currency fluctuations. Understanding the data driving these fluctuations is crucial for success. This involves more than just glancing at price charts; it’s about a deep dive into the information that shapes currency values.
Forex trading data analysis is the backbone of informed decision-making in this dynamic market. Successful traders don’t rely on gut feelings; they leverage data to identify trends, predict potential price movements, and manage risk effectively. The ability to interpret and utilize this data accurately translates directly into improved trading outcomes.
Types of Forex Trading Data
Forex traders utilize a variety of data sources to inform their strategies. These sources provide different perspectives on market conditions, allowing for a more holistic understanding. Ignoring any one type could significantly hinder trading performance.
Significance of Data Analysis in Forex Trading
Effective data analysis allows traders to identify patterns and trends in currency movements, helping them to predict future price changes with increased accuracy. By analyzing historical price data, economic indicators, and news events, traders can develop robust trading strategies that are based on evidence rather than speculation. This reduces risk and improves the probability of profitable trades. Furthermore, risk management, a critical aspect of successful trading, relies heavily on accurate data analysis to determine appropriate position sizing and stop-loss levels.
Data Sources for Forex Trading
Different data sources offer varying levels of detail and reliability. Choosing the right sources is key to making informed trading decisions.
| Data Source | Data Type | Reliability | Cost |
|---|---|---|---|
| Broker Platforms | Price quotes, charts, some economic indicators | Generally high, but varies by broker | Often included in trading fees, sometimes subscription-based for advanced features |
| Financial News Websites (e.g., Bloomberg, Reuters) | News events, economic reports, analyst opinions | High, but requires critical evaluation of sources | Often subscription-based |
| Central Banks (e.g., Federal Reserve, European Central Bank) | Economic data releases, monetary policy statements | Very high, primary source | Free |
| Economic Data Providers (e.g., Trading Economics) | Wide range of economic indicators, historical data | High, but requires understanding of data methodologies | Subscription-based |
Technical Analysis of Forex Data
Unlocking the secrets of the forex market often involves deciphering its historical price movements. Technical analysis provides a framework for doing just that, using charts and indicators to identify trends, predict future price action, and ultimately, make informed trading decisions. It’s a crucial skill for any serious forex trader, allowing them to navigate the complexities of currency fluctuations.
Common Technical Indicators in Forex Trading
Technical indicators are mathematical calculations applied to price data to generate signals about potential market shifts. Understanding and interpreting these signals is key to effective technical analysis. Several popular indicators offer unique perspectives on market momentum and potential turning points.
- Moving Averages (MAs): MAs smooth out price fluctuations, revealing underlying trends. Simple Moving Averages (SMAs) calculate the average price over a specific period, while Exponential Moving Averages (EMAs) give more weight to recent prices. Traders often use multiple MAs (e.g., a 50-day and 200-day SMA) to identify support and resistance levels and potential crossover signals (when one MA crosses another).
- Relative Strength Index (RSI): The RSI measures the magnitude of recent price changes to evaluate overbought or oversold conditions. Readings above 70 generally suggest an overbought market (potential for a price correction), while readings below 30 suggest an oversold market (potential for a price rebound). It’s crucial to remember that RSI divergences (price moving in one direction while RSI moves in the opposite direction) can also be significant signals.
- Moving Average Convergence Divergence (MACD): The MACD uses two moving averages to identify momentum changes. The MACD line crossing above its signal line suggests a bullish signal, while a crossover below indicates a bearish signal. MACD histograms (the difference between the MACD and signal lines) can also provide insights into the strength of the trend.
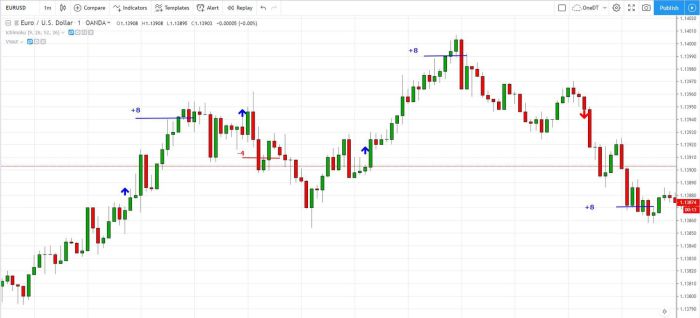
Interpreting Candlestick Patterns
Candlestick charts provide a visual representation of price movements over a specific period, showing the opening, closing, high, and low prices. Specific candlestick patterns can offer clues about potential price reversals or continuations.
- Hammer: A small body with a long lower wick, suggesting a potential bullish reversal after a downtrend.
- Hanging Man: Similar to a hammer but appearing at the top of an uptrend, suggesting a potential bearish reversal.
- Engulfing Pattern: A two-candle pattern where the second candle completely engulfs the first, suggesting a potential trend reversal (bullish engulfing if the second candle is bullish, bearish engulfing if it’s bearish).
Understanding these patterns requires practice and experience in recognizing them within the context of the overall market trend.
A Sample Technical Analysis Strategy
This strategy uses three indicators: 20-period and 50-period EMAs, RSI, and candlestick patterns.
- Trend Identification: Use the 20-period and 50-period EMAs. A bullish trend is indicated when the 20-period EMA is above the 50-period EMA. A bearish trend is indicated when the 20-period EMA is below the 50-period EMA.
- Overbought/Oversold Confirmation: Use the RSI to confirm potential trend reversals. Buy when the RSI is below 30 during an uptrend and sell when it’s above 70 during a downtrend.
- Confirmation with Candlestick Patterns: Look for candlestick patterns (like hammers or engulfing patterns) to confirm entry and exit signals generated by the EMAs and RSI.
This is a simplified example; a robust strategy would incorporate risk management techniques like stop-loss orders and position sizing.
Examples of Successful and Unsuccessful Technical Analysis
Successful technical analysis relies on a combination of accurate indicator interpretation, proper risk management, and understanding market context. A successful scenario might involve identifying a bullish trend using EMAs, confirming it with an RSI reading below 30, and entering a long position at a support level confirmed by a hammer candlestick pattern. Conversely, an unsuccessful scenario could involve misinterpreting an RSI divergence, ignoring a bearish candlestick pattern, or failing to manage risk appropriately, leading to significant losses. Remember, no strategy guarantees success; consistent monitoring, adaptation, and continuous learning are vital.
Fundamental Analysis of Forex Data
Fundamental analysis in forex trading delves into the economic and political factors that drive currency valuations. Unlike technical analysis, which focuses on price charts and patterns, fundamental analysis examines the underlying economic health and geopolitical stability of countries whose currencies are being traded. Understanding these factors is crucial for making informed trading decisions and potentially profiting from shifts in global economic landscapes.
Key Economic Indicators Influencing Forex Rates
Several key economic indicators significantly influence forex rates. These indicators provide insights into a country’s economic strength and stability, directly impacting investor confidence and, consequently, currency demand. A strong economy typically attracts foreign investment, increasing demand for its currency and pushing its value upward. Conversely, a weakening economy often leads to a decrease in currency value.
- Gross Domestic Product (GDP): GDP represents the total value of goods and services produced within a country’s borders. A consistently growing GDP signals economic strength and usually strengthens the associated currency. For instance, a strong GDP growth in the US often leads to increased demand for the US dollar.
- Inflation: Inflation, the rate at which the general level of prices for goods and services is rising, significantly impacts currency values. High inflation erodes purchasing power, making a currency less attractive to investors. For example, consistently high inflation in a country like Argentina often leads to a devaluation of its Peso against stronger currencies.
- Interest Rates: Interest rates set by a country’s central bank influence currency values. Higher interest rates attract foreign investment seeking higher returns, increasing demand for the currency. Conversely, lower interest rates can lead to capital outflow and currency depreciation. The US Federal Reserve’s interest rate decisions, for example, have a significant impact on the value of the US dollar globally.
Impact of Geopolitical Events on Forex Markets
Geopolitical events, encompassing political stability, international relations, and global conflicts, exert a powerful influence on forex markets. These events often create uncertainty, triggering rapid and significant currency fluctuations. Investors react to perceived risk, shifting their investments based on their assessment of the situation.
For example, the outbreak of a major war can cause significant volatility in global currency markets as investors seek safe havens, typically leading to increased demand for currencies of countries perceived as politically stable, like the Swiss Franc or the Japanese Yen. Similarly, political instability within a country can lead to a rapid devaluation of its currency as investors flee the perceived risk. The Brexit vote in 2016, for example, led to a sharp decline in the value of the British Pound.
Comparison of Fundamental Analysis Approaches
Different fundamental analysis approaches exist, each with its strengths and weaknesses. Some analysts focus on specific economic indicators, while others consider a broader range of factors, including qualitative assessments of political risk and social stability.
One common approach involves comparing the economic fundamentals of two countries whose currencies are being traded in a currency pair (e.g., EUR/USD). This comparative analysis helps determine which currency is likely to appreciate or depreciate relative to the other. Another approach involves using econometric models to forecast future economic indicators and their impact on currency values. These models use statistical techniques to analyze historical data and predict future trends. However, the accuracy of these predictions depends on the quality of the data and the model’s assumptions.
Hypothetical Scenario Illustrating Fundamental Analysis’s Influence on Trading Decisions
Imagine a scenario where the US Federal Reserve unexpectedly raises interest rates, while the European Central Bank maintains its low interest rate policy. Fundamental analysis would suggest that the US dollar is likely to appreciate against the Euro, due to the increased attractiveness of US dollar-denominated assets. A trader employing fundamental analysis might decide to buy US dollars and sell Euros (a long position in USD/EUR), anticipating the expected appreciation of the dollar. Conversely, if the US economy shows signs of weakening, while the Eurozone’s economy strengthens, the trader might reverse this position, anticipating a strengthening Euro. The trader’s decision would be based on their assessment of the relative economic strengths of the US and the Eurozone, informed by various fundamental indicators and their impact on the USD/EUR exchange rate.
Data Visualization Techniques
Forex trading, at its core, is about interpreting data. Raw numbers and spreadsheets, however, don’t tell the whole story. Effective data visualization transforms complex forex information into easily digestible insights, revealing trends, patterns, and opportunities that might otherwise remain hidden. Mastering these techniques is crucial for any serious trader.
Various methods exist to visually represent forex data, each with its own strengths and weaknesses. The choice of visualization depends heavily on the type of data being analyzed and the insights you’re seeking. Understanding these methods and their applications is key to unlocking the full potential of your market analysis.
Investigate the pros of accepting forex trading coach in your business strategies.
Chart Types for Forex Data
Different chart types offer unique perspectives on price movements. Candlestick charts, for example, are highly popular due to their ability to convey both price range (high, low, open, close) and direction of movement in a single glance. Line charts provide a simple overview of price trends over time, while bar charts highlight price changes across specific time intervals. Choosing the right chart type significantly impacts your interpretation of the market’s behavior.
For instance, a candlestick chart might clearly show a bearish engulfing pattern (a large bearish candle swallowing a preceding bullish candle), indicating a potential price reversal. A line chart, on the other hand, might smooth out the short-term volatility, emphasizing the overall long-term trend. This illustrates the complementary nature of different chart types.
Visual Representation of a Hypothetical Trading Strategy
Let’s imagine a simple moving average crossover strategy. We’ll use a table to represent this visually. This strategy involves buying when a short-term moving average (e.g., 5-day) crosses above a long-term moving average (e.g., 20-day) and selling when the short-term average crosses below the long-term average.
| Date | 5-Day MA | 20-Day MA | Action |
|---|---|---|---|
| Oct 26 | 1.1000 | 1.0950 | Buy |
| Oct 27 | 1.1020 | 1.0960 | Hold |
| Oct 28 | 1.1050 | 1.0970 | Hold |
| Oct 29 | 1.1030 | 1.0980 | Hold |
| Oct 30 | 1.0990 | 1.1000 | Sell |
This table simplifies the strategy’s execution. A visual representation using line charts would show the crossover points more dynamically, providing a clearer picture of the trading signals generated by this strategy.
Heatmaps for Correlation Analysis
Heatmaps are excellent for visualizing correlations between different currency pairs. A heatmap displays a color-coded matrix, where each cell represents the correlation coefficient between two pairs. Darker colors (e.g., red) indicate strong positive correlation, while lighter colors (e.g., blue) represent strong negative correlation.
For example, a heatmap might show a strong positive correlation between EUR/USD and GBP/USD, suggesting that these pairs tend to move in the same direction. This information can be valuable for diversification and hedging strategies. Conversely, a strong negative correlation might highlight opportunities for pairs trading.
For descriptions on additional topics like que es trading forex, please visit the available que es trading forex.
Examples of Effective and Ineffective Data Visualizations
An effective visualization, such as a well-designed candlestick chart with clear labels and timeframes, instantly communicates price action and trends. An ineffective visualization, on the other hand, might be cluttered with unnecessary details, making it difficult to interpret the data. For instance, a chart with too many overlapping indicators can obscure the underlying price movements.
Similarly, a poorly scaled chart can misrepresent price changes, leading to inaccurate conclusions. Clear, concise visualizations are essential for making informed trading decisions. Overly complex or misleading visualizations can be detrimental to your trading strategy.
Risk Management and Data Analysis

Forex trading, while potentially lucrative, is inherently risky. Successfully navigating the market demands a robust risk management strategy, and data analysis is the key to building one that’s both effective and adaptable. By leveraging historical data and applying statistical methods, traders can significantly improve their odds of long-term profitability while minimizing potential losses. This involves not just understanding the mechanics of risk management tools, but also integrating data-driven insights into every stage of the trading process.
Data analysis empowers traders to make informed decisions, moving beyond gut feelings and intuition. It allows for the objective assessment of risk, the quantification of potential losses, and the development of strategies designed to weather market volatility. This section explores how data analysis techniques can be harnessed to create a comprehensive and effective risk management plan.
Stop-Loss Orders and Position Sizing
Stop-loss orders are crucial for limiting potential losses on individual trades. Data analysis helps determine appropriate stop-loss levels. Instead of arbitrarily setting a stop-loss, traders can analyze historical price volatility to identify support levels or statistically significant price reversals. For instance, analyzing the average true range (ATR) over a specific period can help determine a stop-loss that’s statistically likely to protect against a significant portion of potential losses, without prematurely exiting profitable positions. Position sizing, the amount of capital allocated to each trade, is equally important. Data analysis can inform position sizing by considering the trader’s risk tolerance, account size, and the calculated stop-loss level. A common approach involves limiting risk per trade to a small percentage of the total account balance (e.g., 1-2%). This ensures that even a series of losing trades won’t wipe out the account. Using historical data to model potential drawdowns allows for a more realistic and data-driven approach to position sizing.
Designing a Risk Management Plan, Forex trading data analysis
A comprehensive risk management plan incorporates multiple layers of protection. It begins with defining clear trading goals and risk tolerance. Data analysis plays a crucial role in setting realistic expectations. By analyzing historical performance data of similar trading strategies, traders can estimate potential returns and drawdowns. This helps in aligning expectations with realistic outcomes. The plan should also Artikel specific risk management techniques, including stop-loss orders, position sizing, and diversification. Diversification across different currency pairs or asset classes can reduce overall portfolio risk. Data analysis can assist in identifying optimal diversification strategies by analyzing correlations between different assets. Regular monitoring and adjustment of the plan based on performance data are also essential. Backtesting, discussed below, is a vital component of this ongoing refinement process.
The Role of Backtesting
Backtesting involves simulating a trading strategy on historical data to evaluate its performance. This is crucial for assessing the effectiveness of a risk management plan before deploying it with real capital. By backtesting different stop-loss levels, position sizing strategies, and diversification approaches, traders can identify the most robust and effective combinations. However, it’s essential to acknowledge the limitations of backtesting. Past performance doesn’t guarantee future results, and over-optimization can lead to misleading conclusions. Therefore, robust backtesting should involve a rigorous methodology, including out-of-sample testing and consideration of market regime changes.
Examples of Data Analysis in Risk Mitigation
Analyzing historical volatility can help identify periods of heightened risk. For example, during times of geopolitical uncertainty or significant economic events, volatility often increases. Data analysis can help identify these periods and adjust the trading strategy accordingly, perhaps by reducing position sizes or increasing stop-loss levels. Similarly, analyzing correlation between currency pairs can help identify diversification opportunities. If two currency pairs show a low correlation, investing in both simultaneously can reduce overall portfolio risk. Another example involves using moving averages to identify potential trend reversals. A significant break below a long-term moving average might trigger a stop-loss order, protecting against a potential downtrend.
Algorithmic Trading and Data Analysis
Algorithmic trading, or algo-trading, is revolutionizing the Forex market. It leverages the power of computers to execute trades based on pre-programmed rules and sophisticated data analysis, aiming for speed, efficiency, and consistent profitability. Understanding the role of data analysis in developing these strategies is crucial for success in this increasingly competitive landscape.
Data analysis forms the bedrock of any successful algorithmic trading strategy. It allows traders to identify patterns, predict market movements, and optimize their algorithms for maximum returns. Without robust data analysis, an algorithmic trading strategy is essentially a shot in the dark. The process involves collecting, cleaning, and interpreting vast amounts of historical and real-time market data to uncover actionable insights. These insights then translate into the specific rules and parameters that govern the algorithm’s trading decisions.
Types of Algorithms Used in Forex Trading
Several algorithm types are employed in forex trading, each with its strengths and weaknesses. The choice of algorithm often depends on the trader’s specific goals, risk tolerance, and market conditions.
- Mean Reversion Strategies: These algorithms identify assets that have deviated significantly from their average price, anticipating a return to the mean. The strategy relies on the belief that price fluctuations are temporary and will eventually correct themselves. A simple example would be an algorithm that buys when the price falls below a moving average and sells when it rises above it.
- Trend Following Strategies: These algorithms aim to capitalize on established market trends. They identify the direction of the trend and then execute trades accordingly, aiming to ride the wave of price movements. These strategies often use indicators like moving averages or RSI to identify trends.
- Arbitrage Strategies: These algorithms exploit price discrepancies between different markets or exchanges. They identify instances where the same asset is trading at different prices and execute trades to profit from the difference. This requires fast execution speeds and access to multiple market data feeds.
- News-Based Trading Strategies: These algorithms analyze news headlines and sentiment to predict market reactions. They use natural language processing (NLP) techniques to interpret news articles and social media posts, identifying potential trading opportunities based on market sentiment shifts. This is a more complex strategy requiring advanced NLP capabilities.
Optimizing Algorithmic Trading Strategies Using Historical Data
Historical data is invaluable in optimizing algorithmic trading strategies. By backtesting the algorithm on historical data, traders can assess its performance under various market conditions and identify potential weaknesses. This process involves running the algorithm on past data to simulate its trading activity and evaluate its profitability, maximum drawdown, and other key performance indicators.
The optimization process often involves adjusting the algorithm’s parameters, such as entry and exit points, stop-loss levels, and position sizing, to improve its performance. This is an iterative process, requiring repeated backtesting and adjustments until the algorithm achieves satisfactory results. It’s crucial to remember that backtesting doesn’t guarantee future success, but it significantly enhances the chances of developing a robust and profitable strategy. Over-optimization, fitting the algorithm too closely to historical data, can lead to poor performance in live trading.
Hypothetical Algorithmic Trading Strategy
Let’s consider a hypothetical mean reversion strategy based on the Relative Strength Index (RSI) and a 20-period moving average. The algorithm would buy when the RSI falls below 30 and the price is below the 20-period moving average, indicating oversold conditions and potential price reversal. Conversely, it would sell when the RSI rises above 70 and the price is above the 20-period moving average, indicating overbought conditions. Stop-loss and take-profit orders would be set to manage risk and secure profits. This strategy would be backtested on historical data to optimize the RSI thresholds, moving average period, and risk management parameters. The backtesting would evaluate the strategy’s performance across different timeframes and market conditions, helping to identify its strengths and weaknesses before deploying it in live trading. The performance metrics would include Sharpe ratio, maximum drawdown, and win rate to determine its effectiveness.
Interpreting and Utilizing News and Sentiment Data: Forex Trading Data Analysis
Forex trading isn’t just about charts and algorithms; it’s about understanding the narrative driving market movements. News and sentiment, often intertwined, are powerful forces shaping currency values. Learning to interpret these signals effectively can significantly improve your trading strategy and risk management.
News releases, from central bank announcements to geopolitical events, instantly impact forex markets. The speed and magnitude of these reactions depend on several factors, including the unexpectedness of the news, its perceived economic significance, and the market’s overall mood. Analyzing this data involves more than just reading headlines; it requires understanding the context, implications, and potential follow-up actions.
Interpreting News Releases and Assessing Market Impact
Economic data releases, such as inflation reports, employment figures, and interest rate decisions, are crucial. A surprise increase in inflation, for example, might signal a potential interest rate hike by the central bank. This, in turn, could strengthen the currency as investors seek higher returns. Conversely, weaker-than-expected economic data often leads to currency depreciation. Geopolitical events, like political instability or international conflicts, can also significantly affect currency values, often causing volatility and uncertainty. Analyzing news requires a nuanced understanding of the specific context and potential ripple effects across global markets. For instance, a sudden escalation of a geopolitical conflict could trigger a flight to safety, boosting demand for safe-haven currencies like the Japanese Yen or Swiss Franc while weakening riskier assets.
Analyzing Market Sentiment Using Various Data Sources
Gauging market sentiment involves analyzing various data sources to understand the collective mood of traders. Social media platforms like Twitter can provide a real-time pulse of market sentiment, although caution is necessary due to the potential for misinformation and noise. News articles, financial blogs, and analyst reports offer a more structured approach, providing insights into the prevailing market narrative. Sentiment analysis tools, utilizing natural language processing (NLP), can automatically analyze large volumes of textual data to quantify positive or negative sentiment towards specific currencies or economic events. For example, a surge in negative sentiment surrounding a particular economy might indicate a potential sell-off in its currency.
Impact of Positive and Negative News Sentiment on Forex Prices
Positive news sentiment generally leads to increased demand for a currency, pushing its price higher. This is often seen when positive economic data is released, or when positive news emerges about a country’s political or economic outlook. Conversely, negative news sentiment often triggers selling pressure, driving prices down. This could be triggered by unexpected negative economic data, geopolitical risks, or concerns about a country’s economic stability. The magnitude of the price movement is influenced by the strength of the sentiment, the market’s overall volatility, and the liquidity of the currency pair.
Hypothetical Scenario Illustrating News and Sentiment Influence
Imagine a scenario where the US Federal Reserve unexpectedly announces a larger-than-expected interest rate hike. This positive news for the US dollar would likely trigger a surge in positive sentiment among traders. News articles would highlight the strength of the US economy, and social media would likely show a predominantly positive reaction. As a result, the USD/EUR exchange rate would likely appreciate, as investors move capital into the US dollar seeking higher returns. Conversely, a surprise announcement of a major geopolitical crisis involving a key economic player could trigger a rapid sell-off in riskier assets, leading to a flight to safety and strengthening safe-haven currencies like the Japanese Yen, while negatively impacting the value of riskier currencies like the Australian Dollar. This scenario highlights the dynamic interplay between news, sentiment, and forex price movements.
Conclusion
So, there you have it – a roadmap to navigating the complex world of forex trading data analysis. Remember, consistent learning and adaptation are key. The forex market is dynamic, constantly evolving, and mastering data analysis is an ongoing journey. By understanding and effectively utilizing the various data sources and analytical techniques discussed, you’ll be well-equipped to make more informed trading decisions, manage risk effectively, and ultimately, increase your chances of success. Now go forth and conquer those currency pairs!


