Forex Trading Plan Template: Conquer the volatile world of forex trading with a battle-tested plan. Stop winging it and start winning consistently. This isn’t just about charts and indicators; it’s about building a robust, adaptable system that works *for you*. We’ll dissect the essential components, from defining realistic goals to mastering backtesting and journaling – turning your trading dreams into a profitable reality.
This guide dives deep into crafting a Forex Trading Plan Template that’s more than just a spreadsheet; it’s your personalized roadmap to success. We’ll cover everything from choosing the right template style to integrating advanced market analysis techniques and risk management strategies. Get ready to transform your trading approach and unlock your full potential.
Understanding Forex Trading Plan Templates
So, you’re diving into the thrilling (and sometimes terrifying) world of forex trading? Smart move! But before you throw your hard-earned cash into the volatile market, you need a battle plan – a forex trading plan. And the best way to build that plan? Using a template. Think of it as the architectural blueprint for your forex trading empire. It’s not just about making money; it’s about managing risk and building a sustainable strategy.
A robust forex trading plan template acts as your guide, ensuring you stay focused and disciplined. It’s your personal trading bible, helping you navigate the complexities of the market and avoid emotional decisions.
Essential Components of a Forex Trading Plan Template
A solid forex trading plan template isn’t just a pretty spreadsheet; it’s a comprehensive document covering all aspects of your trading strategy. Key components include defining your trading goals (realistic ones, please!), outlining your risk management strategy (crucial!), specifying your trading style (scalping, day trading, swing trading?), detailing your entry and exit rules (precisely!), and regularly tracking your performance (to learn and adapt!). Missing even one element can weaken your overall strategy. Remember, a well-defined plan increases your chances of success by helping you stay focused and disciplined.
Benefits of Using a Pre-designed Template Versus Creating One From Scratch
Starting from scratch can be tempting, but pre-designed templates offer significant advantages. They provide a structured framework, saving you valuable time and effort. They also often include best practices and considerations you might overlook if you were building it yourself. Think of it like this: would you rather design your own car from the ground up, or use a proven blueprint? A pre-designed template acts as a proven blueprint, ensuring you cover all the essential elements. Furthermore, templates can offer various customization options, allowing you to tailor the plan to your specific needs and trading style.
Comparison of Different Forex Trading Plan Template Styles
Forex trading plan templates come in various styles, each catering to different needs and preferences. Simple templates offer a basic framework, ideal for beginners. They focus on the core elements of a trading plan, providing a straightforward structure. Detailed templates, on the other hand, delve deeper into specific strategies and risk management techniques, perfect for experienced traders. Spreadsheet-based templates offer the advantage of easy data tracking and analysis, allowing for quick calculations and performance monitoring. Choosing the right style depends entirely on your experience level and trading complexity.
Common Mistakes to Avoid When Designing or Using a Forex Trading Plan Template
Even with a template, pitfalls exist. Ignoring these common mistakes can derail your trading efforts.
| Mistake | Solution |
|---|---|
| Unrealistic Goals | Set achievable, incremental goals. Start small and build gradually. |
| Ignoring Risk Management | Implement strict stop-loss orders and position sizing strategies. |
| Lack of a Defined Trading Strategy | Clearly define your entry and exit signals, and stick to them. |
| Failing to Track Performance | Regularly review your trades and identify areas for improvement. |
Defining Trading Goals and Strategies within the Template
Crafting a successful Forex trading plan hinges on clearly defined goals and a robust strategy. Without these, your trading becomes a gamble, not a calculated pursuit of profit. This section Artikels how to establish realistic goals and integrate various trading strategies, complete with risk management, into your template.
Realistic and Achievable Trading Goals
Setting realistic goals is crucial. Avoid aiming for unrealistic returns like doubling your account every month. Instead, focus on consistent, sustainable growth. Consider your risk tolerance, available capital, and the time you can dedicate to trading. A good starting point is to define a target annual return, perhaps 10-15%, which is more achievable and less stressful than aiming for exorbitant gains. Break this annual target into smaller, monthly or quarterly goals. For instance, aiming for a 1% monthly return on your capital is far more manageable and less susceptible to emotional trading decisions than aiming for 10% every month. Track your progress regularly against these goals to stay focused and adapt your strategy as needed.
Forex Trading Strategies and Their Integration
Several Forex trading strategies exist, each with its own risk profile and time horizon. Your template should accommodate different approaches.
Scalping involves taking small profits from many trades throughout the day. It requires quick decision-making, high trading frequency, and a low risk tolerance. Day trading focuses on holding positions for a single trading day, aiming to capitalize on intraday price movements. Swing trading, on the other hand, involves holding positions for several days or weeks, capitalizing on larger price swings. Your trading plan should specify which strategy you’ll primarily use and why. It might even include provisions for adapting between strategies based on market conditions.
Integrating Risk Management Principles
Risk management is paramount. Your trading plan must detail how you’ll protect your capital. Stop-loss orders automatically close a position when the price reaches a predetermined level, limiting potential losses. Take-profit orders automatically close a position when the price reaches a target level, securing profits. Your template should include sections for defining stop-loss and take-profit levels for each trade. These levels should be based on technical analysis, risk tolerance, and market volatility. For example, a stop-loss might be set at 2% below your entry price, while a take-profit might be set at 1% above your entry price, or a more ambitious 1:2 risk-reward ratio. Never risk more than a small percentage of your total capital on any single trade—typically 1-2%.
Sample Section: Entry and Exit Rules for a Swing Trading Strategy
This section provides a template for specifying entry and exit rules for a chosen strategy, using a swing trading example.
| Strategy | Swing Trading (USD/JPY) |
|---|---|
| Entry Rule | Enter a long position when the 20-period moving average crosses above the 50-period moving average, and the RSI is below 30, confirming oversold conditions. |
| Stop-Loss | Place a stop-loss order at 2% below the entry price. |
| Take-Profit | Set a take-profit order at 5% above the entry price, or when the 20-period moving average crosses below the 50-period moving average, whichever comes first. |
| Exit Rule (Additional) | Exit the position if the market shows significant negative news affecting the JPY. |
Remember to always adapt your stop-loss and take-profit levels based on market volatility and your risk tolerance.
Market Analysis and Integration into the Template
A robust forex trading plan isn’t just about setting targets; it’s about understanding the market forces that will either propel your trades to success or send them tumbling. Integrating market analysis into your plan is crucial for informed decision-making and risk management. This involves blending fundamental and technical analysis, incorporating real-time data, and interpreting chart patterns.
This section details how to weave market analysis into the fabric of your forex trading plan template, providing a structured approach to evaluating market conditions and identifying profitable opportunities.
Fundamental Analysis Integration
Fundamental analysis examines the economic and political factors influencing currency values. This includes considering economic indicators (GDP, inflation, interest rates), government policies, geopolitical events, and market sentiment. Within your trading plan template, dedicate a section to track key economic releases and their potential impact on your chosen currency pairs. For example, unexpectedly high inflation in a country might weaken its currency, presenting a shorting opportunity if your analysis supports it. You can use a table to organize this information, noting the expected impact and your planned response. For instance, a negative GDP report for the Eurozone might signal a potential sell opportunity for EUR/USD.
Technical Analysis Integration
Technical analysis uses price charts and indicators to predict future price movements. This section of your trading plan should Artikel which indicators you’ll use (moving averages, RSI, MACD, etc.) and how you’ll interpret their signals. For example, a bullish crossover of a 50-day and 200-day moving average might signal a long position, while an RSI reading above 70 might indicate an overbought condition, suggesting a potential reversal. Clearly define your entry and exit strategies based on these technical indicators. Remember to backtest your chosen indicators to verify their effectiveness in your chosen timeframe and market conditions.
Incorporating Economic Calendars and News Events
Economic calendars provide a schedule of upcoming economic data releases and events. Integrating this into your plan involves noting relevant events and anticipating their market impact. You should specify how you will react to specific news events – for example, a surprise interest rate hike might cause a sharp and immediate currency movement. Your plan should include a section for pre-emptive actions to take (like closing positions or tightening stop-losses) during periods of high volatility surrounding significant news releases. This proactive approach helps manage risk and protect your capital.
Interpreting Chart Patterns and Identifying Trading Opportunities
Chart patterns reveal recurring price formations that can predict future price movements. Your trading plan needs a section dedicated to identifying and interpreting these patterns.
Here’s a structured approach:
- Identify the pattern: Recognize common patterns like head and shoulders, double tops/bottoms, triangles, flags, and pennants.
- Confirm the pattern: Look for confirmation signals, such as increased volume or a breakout from the pattern’s range.
- Determine the potential trade: Based on the pattern, decide whether to go long or short.
- Set stop-loss and take-profit levels: Define your risk tolerance and profit targets.
- Execute the trade: Place your order based on your analysis.
- Monitor and manage the trade: Track the trade’s progress and adjust your position if necessary.
For instance, a head and shoulders pattern often suggests a bearish reversal, prompting a short position. Conversely, a double bottom pattern can signal a bullish reversal, leading to a long position. Always remember to combine chart pattern analysis with other forms of analysis for increased accuracy.
Backtesting and Refinement of the Trading Plan: Forex Trading Plan Template
Crafting a winning Forex trading plan isn’t just about theory; it’s about rigorously testing and refining your strategy to withstand the unpredictable nature of the market. Backtesting, a crucial step often overlooked, allows you to evaluate your plan’s performance using historical data before risking real capital. This process helps identify weaknesses, optimize parameters, and ultimately, increase your chances of success.
Backtesting a forex trading plan involves applying your strategy to historical price data to simulate how it would have performed in the past. This isn’t about predicting the future, but rather about understanding how your strategy would have reacted to various market conditions. By analyzing the results, you can pinpoint areas for improvement and build a more robust and reliable trading plan.
Backtesting Process Using Historical Data
The backtesting process typically involves several key steps. First, you’ll need to gather historical price data for the currency pairs you intend to trade. Many brokers provide this data, or you can find it from reputable financial data providers. Next, you’ll input this data into your trading plan, meticulously tracking each trade signal, entry and exit points, and resulting profit or loss. It’s crucial to maintain consistency and avoid “curve-fitting,” where you adjust your strategy to fit the historical data, thus creating a false sense of accuracy. Software tools and spreadsheets can significantly simplify this process. Remember to use realistic spreads and slippage in your simulations to reflect real-world trading conditions.
Identifying and Addressing Weaknesses in a Trading Plan
Backtesting highlights potential weaknesses in your strategy. For example, you might discover that your system performs poorly during specific market conditions, such as high volatility periods or during economic news releases. Perhaps your stop-loss levels are too tight, leading to frequent whipsaws and losses. Or maybe your entry signals are generating too many false positives, resulting in unnecessary trades. Identifying these weaknesses is the first step towards strengthening your trading plan. A detailed analysis of your backtested trades, categorized by market conditions and trade outcomes, is invaluable in this process.
Adjusting and Refining a Forex Trading Plan
Once you’ve identified weaknesses, you can begin refining your trading plan. This might involve adjusting your entry and exit criteria, modifying your risk management parameters (stop-loss and take-profit levels), or even completely revising your strategy. For example, if your system struggles during high volatility, you might add a volatility filter to your entry rules. If your stop-loss levels are too tight, consider widening them to allow for normal market fluctuations. It’s an iterative process – you backtest, analyze, adjust, and repeat until you’re satisfied with your plan’s performance under various market scenarios.
Documenting and Tracking Performance Over Time, Forex trading plan template
Consistent documentation is vital for long-term success. Regularly tracking your trading plan’s performance allows you to monitor its effectiveness and make necessary adjustments. Below is an example of how you can document your results:
| Date | Trade | Entry Price | Exit Price | Profit/Loss |
|---|---|---|---|---|
| 2024-10-26 | EUR/USD Long | 1.0850 | 1.0900 | +50 pips |
| 2024-10-27 | GBP/USD Short | 1.2200 | 1.2180 | +20 pips |
| 2024-10-28 | USD/JPY Long | 149.00 | 148.50 | -50 pips |
| 2024-10-29 | EUR/USD Short | 1.0920 | 1.0880 | +40 pips |
Remember, this table is a simplified example. You can expand it to include additional relevant data points, such as trade duration, risk-reward ratio, and market conditions at the time of the trade. Regularly updating this table allows for ongoing performance monitoring and informed decision-making.
Journaling and Monitoring Performance
Maintaining a detailed trading journal is crucial for any Forex trader, regardless of experience level. It’s your personal performance tracker, providing invaluable insights into your trading habits, strengths, and weaknesses. Think of it as a laboratory notebook for your trading experiments – meticulous record-keeping allows you to analyze what works and what doesn’t, ultimately refining your strategy and boosting profitability. Without a journal, you’re essentially flying blind.
Consistent journaling allows for objective self-assessment, separating emotions from rational analysis. It helps you identify patterns, pinpoint recurring mistakes, and celebrate successes – all vital steps towards consistent improvement. This isn’t just about recording wins; it’s about understanding the *why* behind both wins and losses.
Key Metrics to Track
Tracking key metrics provides a quantitative measure of your trading performance. These metrics offer objective data, removing the emotional biases that can cloud judgment. By analyzing these numbers, you can identify areas needing attention and refine your approach.
- Win Rate: The percentage of trades that result in profit. A high win rate indicates a potentially strong strategy, but it’s not the sole indicator of success.
- Average Trade Duration: The average length of time a trade remains open. This helps identify optimal holding periods for different strategies.
- Average Profit/Loss per Trade: The average amount gained or lost per trade. This metric, combined with win rate, provides a comprehensive view of profitability.
- Maximum Drawdown: The largest peak-to-trough decline in your trading account’s equity. This critical metric reveals your strategy’s risk tolerance and resilience.
- Profit Factor: The ratio of total profits to total losses. A profit factor greater than 1 indicates profitability, while a value less than 1 suggests losses outweigh gains.
Analyzing Trading Journal Data
Analyzing your trading journal data involves more than just looking at the numbers. It’s about identifying trends and patterns within your trading performance. For example, analyzing your win rate in conjunction with your average trade duration might reveal that longer-term trades are more profitable despite a lower win rate. Conversely, you might discover that trading during specific market hours consistently leads to losses. This level of detail is crucial for identifying and addressing weaknesses.
Consider using spreadsheets or specialized trading journal software to facilitate analysis. Visualizing data through charts and graphs can quickly highlight trends that might be missed when looking at raw numbers. For instance, a chart displaying your maximum drawdown over time can help you assess your risk management strategies. A simple spreadsheet can allow you to filter your trades based on various criteria (e.g., time of day, currency pair, strategy used) to isolate specific areas for improvement.
Forex Trading Plan Template: Journal Section
A structured journal section within your trading plan is essential. It should be easy to use and provide a consistent format for recording trades and analyzing performance. The following bullet points Artikel the essential information to record for each trade:
- Date and Time: Precise timestamps for each trade entry and exit.
- Currency Pair: The specific currency pair traded (e.g., EUR/USD, GBP/JPY).
- Trade Type: Whether the trade was a long (buy) or short (sell) position.
- Entry Price: The price at which the trade was initiated.
- Exit Price: The price at which the trade was closed.
- Stop Loss: The price level at which the trade was automatically closed to limit losses.
- Take Profit: The price level at which the trade was automatically closed to secure profits.
- Profit/Loss: The net profit or loss from the trade in both pips and monetary units.
- Trade Duration: The length of time the trade remained open.
- Reason for Entry: A brief explanation of the rationale behind entering the trade, based on your trading strategy and market analysis.
- Reason for Exit: An explanation for exiting the trade, including whether it was due to hitting the stop loss, take profit, or a discretionary decision.
- Notes: Any additional observations or insights from the trade.
Visual Representations and Illustrations within the Template
A well-structured Forex trading plan isn’t just about numbers and strategies; it’s about visualizing your approach to the market. Visual aids significantly enhance understanding, making complex concepts more accessible and facilitating quicker decision-making. By incorporating charts, diagrams, and strategic color-coding, you can transform your trading plan from a static document into a dynamic tool that supports consistent execution.
Visual representations help you grasp your trading strategy at a glance, quickly identify potential pitfalls, and monitor your progress over time. They translate abstract concepts into concrete, easily digestible information, reducing the risk of misinterpretations and promoting efficient strategy implementation. This section details how to create effective visual aids for your Forex trading plan.
Charting Trading Strategies
A clear visual representation of your trading strategy is crucial. Consider a chart illustrating a simple moving average crossover strategy. The X-axis represents time (e.g., daily, weekly), and the Y-axis represents the price of the currency pair (e.g., EUR/USD). Two moving averages, a 50-day and a 200-day, would be plotted. Data points would show the closing price for each period. When the 50-day moving average crosses above the 200-day moving average, it signals a potential buy signal (represented by a green upward-pointing arrow). Conversely, a cross below signals a potential sell signal (represented by a red downward-pointing arrow). The chart clearly illustrates the strategy’s mechanics, making it easier to understand and implement. Additional data points could include stop-loss and take-profit levels, further clarifying risk management parameters. For example, a horizontal line could represent the stop-loss level, placed below the entry point for a buy trade or above for a sell trade. Another horizontal line could indicate the take-profit level.
Color-Coding and Visual Cues
Strategic use of color-coding significantly enhances readability and usability. For example, you might use green to represent profitable trades, red for losing trades, and blue for pending orders. Different shades could further refine the visual representation; a darker green might indicate exceptionally profitable trades, while a lighter shade represents smaller gains. Similarly, different shades of red could represent varying degrees of loss. Visual cues like arrows, highlighting, or different font styles can further emphasize key data points, such as significant price movements, trend reversals, or crucial decision points within your trading journal. This makes it easy to identify patterns and trends at a glance, allowing for quicker analysis and more informed decision-making.
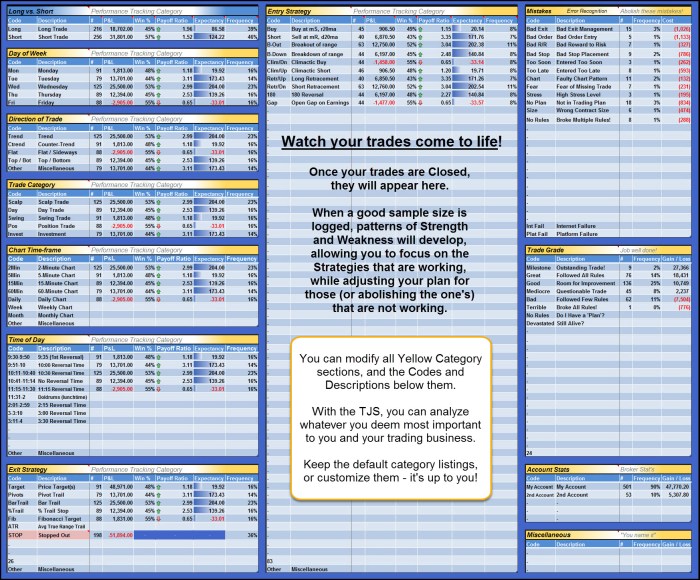
Visualizing Key Performance Indicators (KPIs)
Visualizing KPIs is vital for monitoring performance and identifying areas for improvement. A simple bar chart could display your monthly profit or loss, clearly showing trends over time. A pie chart could illustrate the percentage of your portfolio allocated to different currency pairs, facilitating risk management analysis. A scatter plot could visualize the correlation between your trading frequency and profitability, helping identify optimal trading patterns. Color-coding can further enhance these visualizations; for instance, exceeding a target profit margin could be represented by a vibrant green, while falling below a threshold might be shown in red. These visual representations allow for quick identification of successes and areas requiring adjustment within your trading strategy.
Ultimate Conclusion
Building a winning Forex Trading Plan Template isn’t a one-time task; it’s an ongoing journey of refinement and adaptation. By understanding the core components, integrating effective strategies, and consistently monitoring your performance, you’ll not only improve your trading results but also develop a deeper understanding of the forex market. So, ditch the guesswork, embrace the plan, and watch your trading journey evolve from chaotic to controlled.
Check forex trading how to read charts to inspect complete evaluations and testimonials from users.
Find out about how que es trading forex can deliver the best answers for your issues.


