Forex simulator trading: Dive headfirst into the thrilling world of currency trading without risking your hard-earned cash! Imagine honing your skills, mastering complex strategies, and building confidence – all within a risk-free virtual environment. This isn’t just about learning the ropes; it’s about crafting a winning trading style that’s uniquely yours. Get ready to explore the exciting potential of forex simulators and unlock your inner trading guru.
This guide delves into the mechanics of forex simulator trading, comparing different platforms, highlighting their benefits and drawbacks, and guiding you through strategy development, risk management, and performance analysis. We’ll show you how to leverage simulators to backtest your strategies, refine your approach, and ultimately, prepare yourself for the real forex market. Get ready to transform your trading game.
Defining Forex Simulator Trading
Forex simulator trading offers a risk-free environment to learn and practice forex trading strategies. It mimics the real forex market, allowing traders to execute trades and analyze their performance without risking real capital. This makes it an invaluable tool for beginners and experienced traders alike, providing a space for experimentation and refinement of trading plans.
Forex simulator trading operates by providing a virtual trading account loaded with virtual currency. Traders can then use this virtual money to place trades on various currency pairs, just as they would in a live market. The simulator updates prices based on real-time market data or historical data, allowing traders to experience the dynamic nature of the forex market without the financial consequences. Key metrics like profit and loss are tracked, providing valuable feedback on trading strategies.
Differences Between Forex Simulator and Live Trading
The primary difference lies in the risk involved. Live trading uses real money, meaning profits and losses directly impact the trader’s finances. Conversely, forex simulators use virtual funds, eliminating the financial risk. This distinction allows for a more relaxed learning environment in the simulator, free from the emotional pressure of potential losses. Another key difference is the emotional aspect; the pressure of real money can significantly impact decision-making in live trading, an element largely absent in the simulated environment. Furthermore, simulators often lack the unpredictable market events and sudden shifts that can occur in live trading, providing a somewhat sanitized, yet valuable, learning experience.
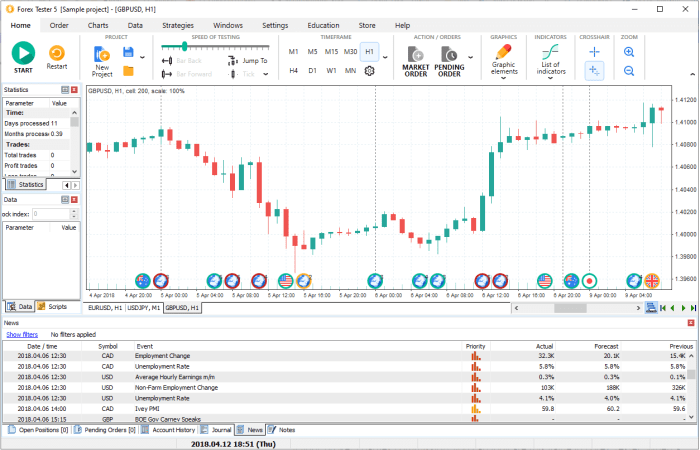
Comparison of Forex Simulator Platforms and Their Features
Several forex simulator platforms are available, each offering a unique set of features and functionalities. Choosing the right platform depends on individual needs and preferences, considering factors such as ease of use, available features, and pricing models. Some platforms offer advanced charting tools and technical indicators, while others focus on simplicity and ease of access. Consideration should also be given to the historical data provided, the range of currency pairs available for trading, and the quality of educational resources offered alongside the simulation.
Forex Simulator Platform Comparison
| Platform | Features | Pricing | User Reviews (Summary) |
|---|---|---|---|
| MetaTrader 4/5 (with demo accounts) | Wide range of indicators, charting tools, automated trading (Expert Advisors), vast community support. | Free (demo accounts); Paid for advanced features/services | Generally positive, praised for its versatility and extensive features; some criticism regarding complexity for beginners. |
| TradingView (Paper Trading) | Advanced charting, extensive technical indicators, social features, backtesting capabilities. | Free (limited features); Paid subscription for full access. | Highly rated for its charting capabilities and user-friendly interface; some users find the paper trading features less robust than dedicated simulators. |
| NinjaTrader (simulated trading) | Advanced charting, backtesting, strategy development tools, automated trading. | Free (limited features); Paid subscription for full functionality. | Popular among advanced traders; praised for its powerful backtesting and strategy development tools; steeper learning curve. |
| FXCM (demo accounts) | Access to various currency pairs, educational resources, realistic trading environment. | Free (demo accounts); Paid for live trading accounts. | Positive reviews regarding the realistic trading environment and educational materials; some complaints about limited charting tools compared to others. |
Benefits and Drawbacks of Forex Simulator Trading
Forex simulator trading offers a compelling blend of risk-free learning and realistic market exposure. It’s a powerful tool for aspiring traders to hone their skills and develop winning strategies before risking real capital. However, like any tool, it has limitations that need careful consideration. Understanding both the advantages and disadvantages is crucial for effective utilization.
Advantages of Forex Simulator Trading
Simulators provide a safe space to experiment with different trading strategies without the financial consequences of real-world losses. This allows for iterative refinement and the identification of weaknesses in your approach. You can test various indicators, chart patterns, and risk management techniques, observing their performance under different market conditions without fear of depleting your trading account. The ability to adjust parameters and settings instantly and repeat trades under similar circumstances facilitates a much deeper understanding of market dynamics.
Limitations of Forex Simulators in Replicating Real-Market Conditions
While simulators offer a valuable training ground, they can’t perfectly mirror the real forex market. The emotional toll of real trading – the pressure, fear, and greed – is absent in a simulated environment. Simulators also often lack the unpredictable events that can significantly impact forex prices, such as sudden geopolitical shifts or unexpected economic announcements. The speed and liquidity of simulated trading may also differ from the real market, potentially leading to a skewed perception of execution and slippage. Furthermore, the data used in simulators may not always reflect real-time market data, leading to inaccuracies.
Examples of How Simulators Improve Trading Strategies
A trader might use a simulator to backtest a new strategy based on a specific indicator. By inputting historical data, they can observe the strategy’s performance over various time periods and market conditions. They can then adjust parameters, such as stop-loss levels or position sizing, to optimize its profitability and risk management. Another example involves practicing specific trade setups, such as scalping or swing trading. The simulator allows repeated practice of these techniques until the trader develops the necessary speed and precision. This iterative process builds confidence and competency before transitioning to live trading.
Potential Pitfalls of Over-Reliance on Forex Simulators
Over-reliance on simulators can create a false sense of security. Success in a simulated environment doesn’t guarantee success in the real market. The absence of emotional pressure and the potential for unrealistic market conditions can lead to overconfidence and poor risk management when trading with real money. Furthermore, simulators might not accurately reflect the complexities of real-world brokerage fees, slippage, and commissions, leading to inaccurate estimations of profitability. A trader who solely relies on simulated trading may lack the experience to adapt quickly to unforeseen market events and unexpected losses, potentially leading to significant financial setbacks when they finally transition to live trading.
Utilizing Forex Simulators for Strategy Development: Forex Simulator Trading
Forex simulators are invaluable tools for refining trading strategies before risking real capital. They provide a risk-free environment to test ideas, identify weaknesses, and optimize approaches, ultimately leading to more informed and potentially profitable trading decisions. This allows traders to learn from mistakes without financial repercussions, a crucial aspect of successful forex trading.
By leveraging the capabilities of a forex simulator, traders can systematically develop, backtest, and refine their strategies, ultimately improving their trading performance and confidence. This iterative process of testing and adjustment is key to achieving consistent profitability in the dynamic forex market.
You also can understand valuable knowledge by exploring forex trading communities.
Sample Trading Strategy and Simulator Implementation
This section details a simple moving average crossover strategy and its implementation within a forex simulator. The strategy uses two moving averages: a fast-moving average (e.g., 10-period) and a slow-moving average (e.g., 20-period). A buy signal is generated when the fast MA crosses above the slow MA, and a sell signal when the fast MA crosses below the slow MA. Within the simulator, you’d input these parameters, select your currency pair (e.g., EUR/USD), and set the timeframe (e.g., 1-hour chart). The simulator will then execute trades based on the crossover signals, recording the results (profits/losses). Visual representation within the simulator would show the moving averages overlaid on the price chart, clearly illustrating the crossover points and resulting trades.
Step-by-Step Guide on Backtesting a Trading Strategy
Backtesting involves using historical data to simulate the performance of a trading strategy. This helps assess its potential profitability and identify potential flaws before using it with real money.
- Define the Strategy: Clearly Artikel your trading rules, including entry and exit signals, stop-loss and take-profit levels, and position sizing.
- Select Data: Choose historical price data for your chosen currency pair and timeframe from a reliable source within your forex simulator.
- Import Data: Import the historical data into your forex simulator.
- Run Backtest: Execute the backtest within the simulator, allowing it to simulate trades based on your strategy and the historical data.
- Analyze Results: Review the backtest results, paying close attention to metrics such as net profit/loss, win rate, average trade duration, maximum drawdown, and Sharpe ratio.
- Refine Strategy: Based on the analysis, adjust your strategy parameters (e.g., moving average periods, stop-loss/take-profit levels) and rerun the backtest to assess the impact of the changes.
Examples of Different Trading Styles and Simulator Testing
Different trading styles require different approaches to strategy development and testing. Forex simulators allow for the testing of diverse strategies across multiple styles.
- Scalping: This involves holding positions for very short periods (seconds to minutes). In a simulator, you’d focus on testing strategies that capitalize on small price fluctuations, utilizing high-frequency data and potentially employing indicators like RSI or stochastic oscillators. Backtesting would involve assessing the frequency of profitable trades and the impact of transaction costs.
- Day Trading: This involves holding positions for a single trading day. Simulators enable testing strategies that identify daily price trends, using indicators such as moving averages, MACD, or Bollinger Bands. Backtesting would emphasize daily profit/loss and the overall consistency of results.
- Swing Trading: This involves holding positions for several days or weeks. Simulators are useful for evaluating strategies based on longer-term price movements, potentially incorporating fundamental analysis alongside technical indicators. Backtesting would focus on the overall return over longer periods and the management of drawdowns.
Comparison of Backtesting Results with Different Parameters
Modifying strategy parameters significantly impacts backtesting results. For example, using a 5-period and 10-period moving average in the moving average crossover strategy will likely produce different results compared to using a 20-period and 50-period moving average. A shorter-term strategy might generate more frequent trades but with smaller profits, while a longer-term strategy might have fewer trades but larger potential profits. The simulator allows you to compare these scenarios, evaluating which parameter set optimizes your risk/reward profile. A table could illustrate the key metrics (e.g., net profit, win rate, maximum drawdown) for each parameter set, facilitating a direct comparison and informed decision-making.
Get the entire information you require about best indicator forex trading on this page.
Risk Management in Simulated Forex Trading
Practicing risk management in a forex simulator is crucial. It allows you to hone your skills and develop a robust trading strategy without the risk of significant financial losses. By understanding and applying risk management principles in a simulated environment, you can transition to live trading with greater confidence and a more defined approach to protecting your capital. This is especially important because, while simulated trading removes the financial risk, it doesn’t remove the risk of developing bad habits or strategies that could be devastating in live trading.
Risk management in simulated forex trading mirrors real-world practices, focusing on controlling potential losses and maximizing profits. The key difference is that the consequences of poor risk management are significantly less severe. This provides a safe space to experiment with various techniques and refine your approach before committing real funds.
Stop-Loss and Take-Profit Orders in a Simulated Environment
Stop-loss and take-profit orders are fundamental risk management tools. A stop-loss order automatically closes a trade when the price moves against you by a predetermined amount, limiting potential losses. A take-profit order automatically closes a trade when the price moves in your favor by a predetermined amount, securing your profits. In a simulated environment, you can easily set and adjust these orders to test their effectiveness under different market conditions. For instance, you might simulate a scenario where a currency pair experiences a sudden and sharp price movement. By having a stop-loss order in place, you prevent a small loss from turning into a substantial one. Conversely, a take-profit order helps you lock in gains when the market reaches your target price. Imagine testing a strategy where you aim for a 2% profit target, setting your take-profit order accordingly. The simulator allows you to repeat this scenario with different settings to observe the results.
Position Sizing in Simulated Forex Trading
Position sizing refers to determining the appropriate amount of capital to allocate to each trade. This is crucial for managing risk, as it directly impacts the potential loss or gain for each trade. In a simulated environment, you can experiment with different position sizing strategies without financial repercussions. For example, you could test a strategy where you only risk 1% of your simulated account balance on any single trade. This approach limits the impact of any losing trade, allowing you to remain in the game even after several consecutive losses. Conversely, you could try a strategy where you risk 2% or more to see how it affects your overall trading performance. The simulator gives you the flexibility to assess the impact of various position sizing strategies on your trading results.
Risk Management Checklist for Simulated Forex Trading
Proper risk management requires a structured approach. Before each simulated trade, consider this checklist:
- Define your trading plan: Specify your entry and exit strategies, including stop-loss and take-profit levels.
- Determine your position size: Calculate the appropriate amount of capital to allocate to each trade, typically limiting risk to a small percentage (e.g., 1-2%) of your simulated account balance.
- Set stop-loss orders: Place stop-loss orders to limit potential losses on each trade.
- Set take-profit orders: Place take-profit orders to secure profits when the market reaches your target price.
- Monitor your trades: Regularly monitor your open trades and adjust your stop-loss and take-profit orders as needed based on market conditions.
- Review your performance: After each trading session, review your trades to identify areas for improvement in your risk management strategy.
- Maintain a trading journal: Document your trades, including entry and exit points, stop-loss and take-profit levels, and the rationale behind your decisions. This will help you track your progress and identify recurring patterns in your trading.
Analyzing Trading Performance in a Forex Simulator
Analyzing your performance in a forex simulator is crucial for improving your trading strategy and managing risk effectively. It allows you to identify weaknesses, refine your approach, and build confidence before risking real capital. By meticulously tracking your trades and key metrics, you can transform simulated losses into valuable learning experiences.
The beauty of a forex simulator lies in its ability to provide a detailed breakdown of your trading activity, offering insights that are difficult to obtain in live trading. This data allows for objective self-assessment, separating emotion from analysis, and ultimately leading to more consistent profitability. Let’s explore how to effectively analyze this performance data.
Key Performance Metrics in Forex Simulator Trading
Understanding key performance indicators is paramount to evaluating your simulated trading. These metrics provide a quantitative assessment of your strategy’s effectiveness and highlight areas needing attention. Ignoring these metrics can lead to stagnation or even losses when transitioning to live trading.
The most important metrics include win rate, average win/loss, and maximum drawdown. Let’s examine each one in detail:
- Win Rate: This metric represents the percentage of your trades that resulted in profits. A high win rate (e.g., above 60%) generally suggests a well-defined strategy and good risk management. However, a high win rate alone isn’t sufficient; the size of your wins and losses also matters significantly.
- Average Win/Loss: This calculates the average profit from winning trades and the average loss from losing trades. A large average win compared to a small average loss indicates a strategy that generates substantial profits when successful. Conversely, a small average win and a large average loss suggests a need for strategy refinement or tighter risk management.
- Maximum Drawdown: This represents the largest peak-to-trough decline during your simulated trading period. It indicates the maximum potential loss you would have experienced had you been trading with real money. A large maximum drawdown suggests vulnerabilities in your risk management strategy. For example, a maximum drawdown of 20% means your account balance decreased by 20% from its peak before recovering.
Interpreting and Utilizing Performance Data
Let’s consider a hypothetical example. Suppose a trader achieves a 55% win rate, an average win of $150, and an average loss of $100. While the win rate is decent, the average win is significantly larger than the average loss, suggesting a profitable strategy. However, if the maximum drawdown was 30%, it highlights a potential vulnerability requiring attention. The trader should analyze trades contributing to the drawdown, potentially identifying patterns or triggers that led to substantial losses.
Another example: A trader with a 70% win rate, an average win of $50, and an average loss of $200 shows a concerning scenario. Despite the high win rate, the large average loss offsets the frequent small wins. This highlights the importance of considering both win rate and the magnitude of wins and losses. A significant drawdown might also be present in this case.
Identifying Areas for Improvement, Forex simulator trading
Analyzing your simulated trading performance helps identify areas needing refinement. For instance, if your maximum drawdown is consistently high, it indicates a need for stricter risk management techniques, perhaps by using smaller position sizes or implementing stop-loss orders more effectively. If your average loss is substantially larger than your average win, it might be necessary to re-evaluate your entry and exit strategies.
By examining individual trades that contributed significantly to losses or drawdowns, you can identify recurring patterns or mistakes. Perhaps you consistently enter trades during periods of high volatility or fail to adjust your strategy based on market conditions. These insights are invaluable for refining your approach.
Simulated Trading Performance Report
A detailed report should include:
| Metric | Value | Interpretation/Action |
|---|---|---|
| Win Rate | 50% | Below average; needs improvement. Review entry/exit strategies. |
| Average Win | $120 | Acceptable, but could be higher. Explore higher-probability setups. |
| Average Loss | $150 | Higher than average win, needs immediate attention. Tighten stop-loss orders. |
| Maximum Drawdown | 15% | Moderate; acceptable, but monitor closely. Improve risk management. |
| Total Number of Trades | 100 | Sufficient sample size for analysis. |
| Total Profit/Loss | -$300 | Net loss; requires immediate strategy adjustments. |
This report summarizes key performance metrics, providing a clear picture of the trading strategy’s effectiveness and highlighting areas requiring attention. The “Interpretation/Action” column guides improvement strategies based on the results.
Visualizing Forex Simulator Data
Harnessing the power of a forex simulator isn’t just about executing trades; it’s about understanding the bigger picture. Visualizing your trading data through charts and graphs is crucial for gleaning insights you might otherwise miss, turning raw numbers into actionable knowledge. This allows you to identify patterns, assess your strategy’s effectiveness, and ultimately, improve your trading performance.
Visual representations of key trading metrics offer a powerful way to track progress and identify areas for improvement. By transforming complex data sets into easily digestible visual formats, you can quickly spot trends, assess risk, and make informed decisions. This is especially vital in simulated trading where the consequences are less severe, allowing for experimentation and learning without significant financial risk.
Equity Curve Charts
An equity curve chart provides a visual representation of your account balance over time. It plots your cumulative profit or loss after each trade, offering a clear picture of your overall performance. A rising equity curve indicates consistent profitability, while a volatile or declining curve suggests potential issues with your strategy or risk management. Let’s consider a hypothetical scenario.
Imagine a trader starts with a $10,000 simulated account. Over 10 trading days, their equity curve might look like this: Day 1: $10,100 (+$100 profit); Day 2: $10,250 (+$150 profit); Day 3: $10,000 (-$250 loss); Day 4: $10,300 (+$300 profit); Day 5: $10,500 (+$200 profit); Day 6: $10,400 ( -$100 loss); Day 7: $10,600 (+$200 profit); Day 8: $10,700 (+$100 profit); Day 9: $10,500 ( -$200 loss); Day 10: $10,800 (+$300 profit).
This data would be represented on a chart with the x-axis representing trading days and the y-axis representing account balance. The line connecting the points would show the ups and downs of the account balance over the 10-day period. A consistently upward-sloping line indicates a profitable trading strategy. Sharp drops indicate periods of significant losses, highlighting potential areas for improvement in risk management. A flat line suggests the strategy is neither consistently profitable nor consistently losing. Analyzing the shape and trend of this line provides crucial insights into the performance and stability of the trading strategy.
The Importance of Data Visualization for Pattern Identification
Visualizing your trading data is paramount for identifying patterns and trends. Simply looking at spreadsheets of numbers can be overwhelming and may obscure underlying trends. Charts and graphs make it easier to spot recurring patterns in your trading, such as consistent losses on specific days of the week or during particular market conditions. For example, a bar chart showing daily profit/loss could reveal a tendency to underperform on Mondays, suggesting a need to adjust your trading strategy or avoid trading on that day. Similarly, a scatter plot could show a correlation between trade size and profitability, helping you optimize position sizing. By identifying these patterns, you can refine your trading approach, improve risk management, and ultimately increase your chances of success in live trading.
Epilogue
Mastering forex trading requires dedication and the right tools. Forex simulators offer a powerful, risk-free environment to hone your skills, test strategies, and develop a winning approach. By understanding the nuances of simulator trading, analyzing your performance, and implementing effective risk management, you can significantly increase your chances of success in the live forex market. So, are you ready to take the plunge and transform your trading journey?


