Forex line trading: sounds kinda boring, right? Wrong. It’s the secret weapon seasoned traders use to predict market moves with laser-like precision. Forget crystal balls; we’re talking about using simple lines – trend lines, support and resistance – drawn directly onto forex charts to spot potential profit opportunities. Think of it as decoding the market’s hidden language, revealing where prices are likely to go next. Get ready to ditch the guesswork and embrace the power of visual analysis.
This guide breaks down forex line trading from the ground up. We’ll cover everything from identifying key levels and trends to mastering advanced techniques like confluence and combining lines with other indicators. We’ll even show you how to manage risk effectively so you can confidently navigate the exciting (and sometimes volatile) world of forex.
Defining Forex Line Trading
Forex line trading is a technical analysis method used by traders to identify potential support and resistance levels, predict price movements, and ultimately, make informed trading decisions. It’s a visually intuitive approach that relies on drawing lines on a price chart to highlight significant price action and potential future price behavior. While not a foolproof system, it provides a valuable framework for understanding market trends and identifying potential entry and exit points.
Forex line trading hinges on the principle that past price action often dictates future price movements. By connecting significant high or low points on a chart, traders create lines that represent areas of price consolidation or potential reversal. These lines, then, become dynamic indicators of support and resistance, helping traders anticipate where the price might bounce or break. The accuracy of these predictions depends heavily on the trader’s ability to correctly identify significant price points and interpret the overall market context.
Types of Lines Used in Forex Line Trading
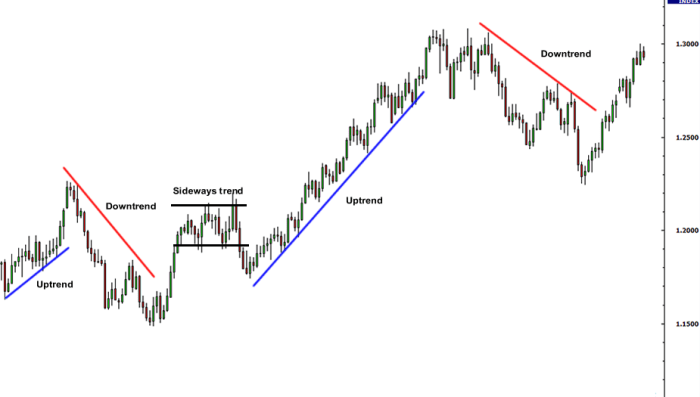
Several types of lines are used in forex line trading, each serving a specific purpose. Understanding the nuances of each line type is crucial for effective analysis. The most common include trend lines, support lines, and resistance lines. Trend lines connect a series of higher lows (uptrend) or lower highs (downtrend), highlighting the dominant direction of the market. Support lines are drawn below price troughs, representing levels where buying pressure is expected to overcome selling pressure, preventing further price declines. Resistance lines, conversely, are drawn above price peaks, marking areas where selling pressure might outweigh buying pressure, halting further price increases.
Drawing Lines on Forex Charts
Drawing lines accurately is paramount. For trend lines, connect at least two significant swing lows (for uptrends) or swing highs (for downtrends). These swing points represent periods of temporary price reversal before the trend resumes. For support lines, identify at least two lows where the price bounced back up. Similarly, for resistance lines, identify at least two highs where the price reversed downwards. The lines should ideally be drawn with a slight angle, avoiding perfectly horizontal or vertical lines, which are less reliable. The more touchpoints a line has, the stronger it’s considered.
Effectiveness of Different Line Types in Various Market Conditions
The effectiveness of different line types varies considerably depending on the prevailing market conditions. In trending markets, trend lines are typically more reliable, whereas in ranging markets, support and resistance lines prove more useful. The following table provides a comparison:
| Line Type | Trending Market | Ranging Market | Choppy Market |
|---|---|---|---|
| Trend Lines | High Effectiveness | Low Effectiveness | Low Effectiveness |
| Support Lines | Moderate Effectiveness | High Effectiveness | Low Effectiveness |
| Resistance Lines | Moderate Effectiveness | High Effectiveness | Low Effectiveness |
Identifying Key Levels and Trends
Line trading in forex hinges on accurately identifying key support and resistance levels and discerning the prevailing trend. Mastering these skills is crucial for successful trading, allowing you to enter trades with a higher probability of success and manage risk effectively. This section will delve into the practical strategies and techniques for achieving this.
Identifying significant support and resistance levels is the cornerstone of line trading. These levels represent price points where the market has historically shown a tendency to pause, reverse, or consolidate. By drawing trendlines connecting these points, traders can anticipate future price movements. The strength of these levels is directly proportional to the number of times the price has bounced off them. A level tested multiple times holds more significance than one touched only once.
Support and Resistance Level Identification
Support levels are areas where buying pressure is expected to outweigh selling pressure, preventing further price declines. Resistance levels, conversely, are areas where selling pressure is anticipated to dominate, halting price increases. In line trading, these levels are often identified by drawing trendlines connecting swing lows (for support) and swing highs (for resistance). A swing low is the lowest point in a price swing, while a swing high is the highest. The more times a trendline is tested and respected by the price, the more significant it becomes. For example, if a trendline connecting several swing lows consistently holds, a break below it could signal a significant bearish reversal. Similarly, a break above a trendline connecting several swing highs could signal a bullish reversal.
Trend Direction Determination
Determining the overall trend direction is paramount. Line trading utilizes trendlines to visually represent the prevailing trend. An uptrend is characterized by a series of higher highs and higher lows, while a downtrend is marked by lower highs and lower lows. Drawing trendlines connecting these highs and lows provides a clear visual representation of the trend’s direction and strength. A strong uptrend will show a steep upward-sloping trendline, while a weak uptrend will have a shallower slope. Similarly, a strong downtrend will exhibit a steep downward slope. A sideways or ranging market will show little to no clear trendline.
Confirming Line Signals with Technical Indicators
While line trading is a powerful tool, relying solely on trendlines can be risky. Confirming line signals with other technical indicators adds a layer of confidence and reduces the likelihood of false signals. For instance, the Relative Strength Index (RSI) can help confirm overbought or oversold conditions, aligning with potential support or resistance breaks. Moving averages can provide additional confirmation of the trend direction. A bullish trend confirmed by both an upward-sloping trendline and a rising moving average is a much stronger signal than one based solely on a trendline.
Identifying Trend Reversals Using Line Breakouts
A step-by-step guide to identifying trend reversals using line breakouts involves several key steps. First, identify the prevailing trend using trendlines connecting swing highs and lows. Second, observe the price action at the support or resistance levels defined by these trendlines. Third, look for signs of weakening trend momentum. This might manifest as smaller price swings or a failure to reach new highs/lows. Fourth, monitor for a decisive break of the trendline. A break below a support trendline in an uptrend, or above a resistance trendline in a downtrend, suggests a potential trend reversal. Fifth, confirm the reversal with other technical indicators such as volume or RSI to increase the probability of a successful trade. For example, a breakout below a support line accompanied by increased volume would be a stronger confirmation signal.
Practical Applications of Forex Line Trading
Forex line trading, while seemingly simple, offers a powerful framework for navigating the complexities of the forex market. By identifying key support and resistance levels, traders can pinpoint potential entry and exit points with increased precision, ultimately improving their trading strategy. Understanding how these lines interact with price action is key to unlocking consistent profitability.
Entering and Exiting Trades Using Line Trading
Line trading provides clear signals for both entering and exiting trades. Entry signals typically occur when the price breaks above a resistance line (for long positions) or below a support line (for short positions). Conversely, exit signals often emerge when the price reverses at a previously broken line, indicating a potential trend reversal or profit-taking opportunity. This approach helps traders manage risk by defining clear targets and stop-loss levels. For example, a long position might be entered when the price decisively breaks above a significant resistance line, with a stop-loss placed just below the line. The profit target could be set at a predetermined distance or another key resistance level.
Examples of Trade Setups Based on Line Interactions
Let’s consider two common scenarios: line breakouts and bounces. A line breakout occurs when the price decisively moves beyond a previously established support or resistance line. This signifies a potential trend change, offering a high-probability entry point. Conversely, a line bounce involves the price reversing direction after reaching a support or resistance line. This presents an opportunity for a swing trade, profiting from the anticipated price rebound. Imagine a scenario where the EUR/USD pair consistently bounces off a support line at 1.1000. A trader could enter a long position near this level, anticipating a price move back towards the resistance line at 1.1100.
Case Study: A Successful Forex Trade Using Line Trading
Consider a GBP/USD trade. A clear uptrend was established, marked by a series of higher highs and higher lows. A support line was drawn connecting the lower lows. When the price tested this support line, a long position was entered. The stop-loss was placed just below the support line. The price subsequently broke through a resistance line, confirming the uptrend. The trade was closed when the price reached a pre-determined profit target, a previously identified resistance level based on a longer-term trendline. This resulted in a successful trade, demonstrating the efficacy of line trading.
Common Line Trading Mistakes and How to Avoid Them
| Mistake | Description | How to Avoid | Example |
|---|---|---|---|
| Ignoring Context | Drawing lines without considering broader market trends or news events. | Analyze overall market sentiment and fundamental factors before drawing lines. | Drawing a support line during a major economic crisis might be unreliable. |
| Over-reliance on Single Lines | Relying solely on one line for entry/exit decisions. | Use multiple lines and indicators to confirm signals. | Confirming a breakout with volume and other indicators. |
| Poor Line Drawing | Drawing inaccurate or subjective lines. | Use clear swing highs and lows to draw lines. | Using clear price points instead of arbitrary levels. |
| Ignoring Risk Management | Failing to set appropriate stop-loss orders. | Always set stop-loss orders to limit potential losses. | Placing a stop-loss below the support line in a long position. |
Risk Management in Forex Line Trading
Forex line trading, while offering the potential for significant profits, is inherently risky. Success hinges not just on identifying trends and key levels, but crucially, on implementing robust risk management strategies. Without a disciplined approach to risk, even the most accurate line readings can lead to substantial losses. This section explores essential risk management techniques specifically tailored for line trading.
Stop-Loss Orders and Position Sizing
Stop-loss orders are your safety net in forex trading. In line trading, they become even more critical because you’re often holding positions for longer periods, potentially exposing yourself to greater price fluctuations. A well-placed stop-loss order limits your potential losses to a predetermined amount. Position sizing complements stop-loss orders by controlling the amount of capital at risk on any single trade. By carefully calculating position size based on your risk tolerance and account balance, you can prevent a single losing trade from decimating your account. For example, a trader might risk only 1% of their account balance on any given trade, regardless of the potential profit. This ensures that even a series of losing trades won’t lead to catastrophic losses. A simple formula to calculate position size is: (Account Balance * Risk Percentage) / Stop Loss in Pips.
Strategies for Managing Risk and Protecting Profits, Forex line trading
Effective risk management in line trading involves a multi-pronged approach. One strategy is to use trailing stop-losses. These automatically adjust your stop-loss order as the price moves in your favor, locking in profits and protecting gains. Another key technique is to diversify your trades across multiple currency pairs, reducing the impact of a single losing trade. Furthermore, employing a disciplined approach to entry and exit points, based on your identified lines and support/resistance levels, minimizes unnecessary risk. Regularly reviewing your trading plan and adjusting your strategy based on market conditions is also essential.
Impact of Market Volatility on Line Trading Strategies
Market volatility significantly impacts line trading strategies. During periods of high volatility, price movements can be unpredictable, making it more challenging to accurately identify and trade key levels. In such instances, it’s crucial to tighten stop-losses or even temporarily reduce trading activity. Conversely, during periods of low volatility, line trading can be more effective, as price movements are more predictable, allowing for tighter stop-losses and potentially higher profit targets. Adaptability is key; your strategy should adjust to the prevailing market conditions.
Examples of Risk Management Techniques Integrated with Line Trading
Consider a trader using a support line as a buy entry point. Their risk management strategy might involve placing a stop-loss order just below the support line, limiting potential losses. Simultaneously, they might use a trailing stop-loss, adjusting it upwards as the price moves above the support line, protecting profits. Another example involves a trader using a resistance line as a sell entry point. Their stop-loss would be placed just above the resistance line, while their profit target might be a predetermined distance below the line, or a specific Fibonacci retracement level. This meticulous approach ensures that risk is carefully managed while maximizing potential gains.
Advanced Line Trading Techniques
Leveling up your Forex line trading game involves more than just drawing lines on a chart. It’s about mastering advanced techniques that enhance accuracy and risk management. This section explores strategies that leverage multiple timeframes, indicator combinations, and confluence analysis to refine your trading decisions.
Advanced line trading isn’t about complexity for complexity’s sake; it’s about building a more robust and reliable trading system. By integrating multiple perspectives and analytical tools, you can increase your confidence in identifying high-probability trading setups and minimizing losses.
Obtain access to forex trading group to private resources that are additional.
Multi-Timeframe Analysis in Line Trading
Employing multiple timeframes provides a holistic view of price action. For example, identifying a significant support level on a daily chart and then confirming its strength with a corresponding upward trendline on a 4-hour chart significantly increases the probability of a successful long trade. Conversely, observing a breakdown below a support line on a higher timeframe, followed by confirmation on a lower timeframe, could signal a strong bearish signal. This approach minimizes the noise inherent in shorter timeframes while capitalizing on the dynamic shifts captured by higher timeframes.
Confluence in Line Trading
Confluence refers to the convergence of multiple indicators or price action elements at a single point. In line trading, this could involve the intersection of multiple trendlines, support/resistance levels, or the alignment of a trendline with a significant Fibonacci retracement level. A strong confluence zone often indicates a high-probability area for price reversal or continuation. For instance, if three trendlines converge at a specific price level, and this level also coincides with a previous swing high or low, the confluence strengthens the potential significance of this point as a crucial support or resistance level.
Comparing Different Line Trading Approaches
Various line trading approaches exist, each with its strengths and weaknesses. For instance, some traders focus solely on trendlines, while others incorporate support and resistance levels derived from swing highs and lows. Some traders prefer using only parallel lines, while others may incorporate angular lines to account for dynamic price movements. The optimal approach depends on individual trading styles and market conditions. Scalpers might favor shorter-term trendlines and dynamic support/resistance, while swing traders might prioritize longer-term trendlines and established support/resistance zones. No single approach is universally superior; adaptability is key.
Fibonacci Retracements and Line Trading
Fibonacci retracements, based on the Fibonacci sequence, can be incredibly useful when combined with line trading. These retracements identify potential support and resistance levels within a trend. By observing where a trendline intersects with a key Fibonacci retracement level (such as 38.2%, 50%, or 61.8%), traders can identify potential reversal or consolidation zones. For example, a strong uptrend might experience a pullback to the 38.2% Fibonacci retracement level, which could coincide with a previously established trendline support, providing a high-probability entry point for a long trade. The combination of these tools offers a more comprehensive view of price dynamics and potential turning points.
Illustrative Examples

Let’s dive into some real-world scenarios to solidify your understanding of forex line trading. We’ll examine how to identify trends, manage risk, and potentially profit using this powerful technique. Remember, these are illustrative examples and past performance is not indicative of future results. Always practice responsible risk management.
Strong Uptrend Identification
Imagine the EUR/USD pair on a daily chart. Over several weeks, we observe consistently higher highs and higher lows. We draw a line connecting the lower lows, forming a support line. Another line connecting the higher highs creates a resistance line. However, as the price action progresses, the resistance line is consistently broken, with the price creating new higher highs above the previous resistance. This persistent upward movement, with the price consistently staying above the rising support line and breaking through previous resistance levels, clearly indicates a strong uptrend. The angle of the support line, relatively steep, further confirms the strength of this bullish momentum. A trader might enter long positions above the previous resistance line, now acting as support, with a stop-loss order placed slightly below the rising support line.
Trend Reversal Detection
Now, consider the GBP/USD pair on a 4-hour chart. For several days, we observe a clear downtrend, with consistently lower lows and lower highs. We draw two lines: a resistance line connecting the higher highs and a support line connecting the lower lows. However, we notice a significant change in price action. The price breaks through the support line, followed by a period of consolidation. Crucially, the price then fails to retest the broken support line, now acting as resistance. This failure to retest, coupled with a clear break above the previous resistance line, signals a potential trend reversal. The formation of a higher high and higher low after the break confirms this reversal. A trader might consider entering a long position after the confirmation, placing a stop-loss order below the newly established support level (the previous resistance line).
Support/Resistance Lines for Risk and Profit Management
Let’s examine the USD/JPY pair on a 1-hour chart. We identify a clear support line based on previous lows and a resistance line based on previous highs. A trader might enter a long position when the price bounces off the support line, setting a stop-loss order just below the support line to limit potential losses. As the price approaches the resistance line, the trader might decide to take partial profits, securing some gains while letting the remaining position run with a trailing stop-loss to protect profits as the price moves further upwards. If the price breaks through the resistance line, the trader might consider closing the remaining position to avoid potential losses, or adjust the stop-loss to break-even to protect the already gained profit. Conversely, if the price breaks the support line, the stop-loss order would trigger, minimizing potential losses. This exemplifies how support and resistance lines are crucial for defining entry and exit points, managing risk, and maximizing potential profits.
Final Thoughts: Forex Line Trading
So, you’ve cracked the code to forex line trading. Remember, mastering this skill isn’t about overnight riches; it’s about developing a keen eye for market patterns and understanding how to use lines to your advantage. Consistent practice, risk management, and a dash of patience are your best allies. Now go out there and start charting your course to forex success. The market awaits!
Learn about more about the process of uk forex trading brokers in the field.