
How to Use RSI in Forex Trading? Unlocking the secrets of this powerful indicator isn’t rocket science, but it does require understanding its nuances. We’ll dissect RSI, from identifying overbought and oversold conditions to crafting winning trading strategies. Get ready to level up your forex game!
This guide navigates the complexities of the Relative Strength Index (RSI), a momentum oscillator used to gauge the speed and change of price movements. We’ll cover everything from the basics—interpreting RSI values (0-100) and spotting those crucial overbought and oversold signals—to advanced techniques like identifying divergences and combining RSI with other indicators for a more robust trading approach. Prepare for a deep dive into practical application, complete with real-world examples and case studies to illustrate both successful and unsuccessful trades.
Introduction to RSI in Forex Trading
Navigating the volatile world of forex trading requires sharp tools, and the Relative Strength Index (RSI) is a particularly handy one. This indicator helps traders gauge the momentum of price movements and identify potential overbought or oversold conditions, offering valuable insights into potential trend reversals or continuation. Essentially, it’s a way to peek into the market’s emotional state – is it getting too excited (overbought) or too pessimistic (oversold)?
RSI measures the magnitude of recent price changes to evaluate overbought or oversold conditions in the price of a forex pair. It’s a momentum indicator, meaning it focuses on the speed and strength of price changes rather than just the price itself. Understanding its signals can significantly improve your trading decisions, helping you time entries and exits more effectively.
RSI Values and Interpretations
The RSI oscillates between 0 and 100. Readings above 70 are generally considered overbought, suggesting the asset might be due for a correction or pullback. Conversely, readings below 30 are typically seen as oversold, hinting at a potential bounce. It’s crucial to remember that these are guidelines, not hard and fast rules. Markets can remain overbought or oversold for extended periods, especially during strong trends. For example, during a strong uptrend, the RSI might stay above 70 for weeks, while during a strong downtrend, it might remain below 30.
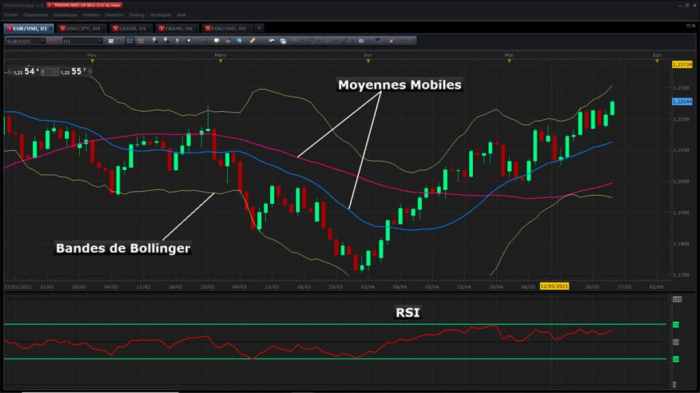
Adding RSI to a Forex Chart
Adding the RSI indicator to your forex chart is usually a straightforward process. The exact steps might vary slightly depending on the trading platform you’re using (MetaTrader 4, MetaTrader 5, TradingView, etc.), but the general procedure is similar.
First, open the chart of the forex pair you want to analyze. Then, locate the indicator section within your platform’s menu. This is often found under a tab labelled “Indicators,” “Technical Indicators,” or something similar. Within this section, search for “RSI” or “Relative Strength Index.” Select the RSI indicator and it will be added to your chart. You’ll then be presented with settings to customize the indicator’s look and parameters, such as the period length (typically 14). This number refers to the number of periods used in the RSI calculation; a 14-period RSI is the most common. Once you’ve made your adjustments, click “OK” or a similar button to apply the indicator to your chart. The RSI will appear as a separate line oscillating between 0 and 100, typically displayed below the price chart.
Understanding RSI Signals: How To Use RSI In Forex Trading
The Relative Strength Index (RSI) isn’t a crystal ball, but it’s a powerful tool for gauging momentum and identifying potential turning points in the Forex market. Understanding how to interpret its signals—specifically overbought and oversold levels, and divergences—is key to successfully incorporating RSI into your trading strategy. Remember, RSI is most effective when used in conjunction with other technical indicators and sound risk management.
RSI values typically range from 0 to 100. Readings above 70 are generally considered overbought, suggesting the market is nearing a potential price correction or reversal. Conversely, readings below 30 are considered oversold, hinting at a possible price bounce or uptrend. However, it’s crucial to remember that these are guidelines, not absolute rules. Markets can remain overbought or oversold for extended periods, especially in strong trends.
Overbought and Oversold Conditions
The RSI’s overbought and oversold thresholds (typically 70 and 30, respectively) provide valuable clues about potential price reversals. When the RSI climbs above 70, it indicates strong buying pressure, suggesting the asset might be overvalued and ripe for a correction. Conversely, an RSI reading below 30 suggests intense selling pressure, implying the asset might be undervalued and poised for a bounce. However, it’s vital to remember that these levels aren’t always definitive signals. Breakouts beyond these levels can also signal a continuation of the current trend. For example, an RSI staying above 70 for an extended period could indicate a very strong uptrend, and a subsequent move above 80 might confirm this strength.
Price Action and RSI Divergence
Divergence occurs when the price action and the RSI move in opposite directions. This discrepancy often foreshadows a potential trend reversal. Bullish divergence happens when the price makes lower lows, but the RSI forms higher lows. This suggests weakening selling pressure and hints at a possible upward price correction. Bearish divergence, conversely, occurs when the price makes higher highs, but the RSI creates lower highs, indicating waning buying pressure and hinting at a potential downward correction. Identifying and understanding these divergences can provide valuable early warning signs of potential trend changes.
Examples of Bullish and Bearish Divergences
Let’s illustrate with hypothetical examples. Imagine a scenario where the EUR/USD pair makes lower lows on the price chart, say 1.1000, then 1.0950. However, the RSI forms higher lows, perhaps 25, then 30. This bullish divergence suggests that despite the price decline, buying pressure is increasing, potentially signaling an upcoming price rebound. Conversely, if the EUR/USD makes higher highs, for example 1.1100, then 1.1150, but the RSI forms lower highs, say 70, then 65, it signals bearish divergence. This implies that despite the price increase, buying pressure is weakening, suggesting a potential price reversal downward. These scenarios highlight the predictive power of divergence analysis.
Bullish and Bearish Divergence Comparison
| Feature | Bullish Divergence | Bearish Divergence |
|---|---|---|
| Price Action | Makes lower lows | Makes higher highs |
| RSI | Makes higher lows | Makes lower highs |
| Signal | Potential upward correction | Potential downward correction |
| Interpretation | Weakening selling pressure, increasing buying pressure | Weakening buying pressure, increasing selling pressure |
RSI and Trading Strategies
RSI, while powerful on its own, becomes even more effective when combined with other technical indicators. Understanding how to integrate RSI into a broader trading strategy is key to maximizing its potential and minimizing risk. This section explores various strategies, highlighting their strengths and weaknesses.
RSI Combined with Moving Averages
Moving averages provide context for RSI readings. A bullish crossover of a short-term moving average (e.g., 20-period) over a long-term moving average (e.g., 50-period), coupled with an RSI above 30, suggests a potential buying opportunity. Conversely, a bearish crossover with an RSI below 70 hints at a potential shorting opportunity. This combination helps filter out false signals that might occur when using RSI alone. For instance, a short-term spike in price might push the RSI above 70, indicating an overbought condition, even if the overall trend is still bullish. The moving average crossover would help to confirm or negate the RSI signal.
Developing a Simple RSI-Based Trading Strategy
A simple RSI-based strategy can be developed using the following steps:
- Choose your timeframe: Select a timeframe that suits your trading style (e.g., 1-hour, 4-hour, daily). Consistency is crucial.
- Set your RSI parameters: The standard RSI uses a period of 14, but you can experiment with different periods.
- Define overbought and oversold levels: Typically, levels above 70 are considered overbought, and levels below 30 are considered oversold. You can adjust these levels based on your experience and the specific market conditions.
- Identify entry and exit signals: Buy when the RSI crosses above 30 from below, indicating a potential reversal from oversold conditions. Sell when the RSI crosses below 70 from above, indicating a potential reversal from overbought conditions. Consider using price action confirmation before entering a trade.
- Implement risk management: Always use stop-loss orders to limit potential losses and take-profit orders to secure profits. Never risk more than a small percentage of your trading capital on any single trade.
Comparison of RSI Trading Strategies
Several strategies utilize RSI in different ways.
- Mean Reversion Strategy: This strategy involves buying when the RSI is below 30 (oversold) and selling when it’s above 70 (overbought), anticipating a price reversal towards the mean. The assumption is that extreme price movements are temporary and the price will eventually revert to its average.
- Momentum Strategy: This strategy focuses on identifying strong trends. Buy when the RSI is above 50 and rising, indicating strong upward momentum. Sell when the RSI is below 50 and falling, indicating strong downward momentum. This strategy aims to capitalize on the continuation of existing trends rather than reversals.
RSI Trading Strategies: Entry and Exit Points
- Mean Reversion:
- Entry: RSI crosses above 30 (buy); RSI crosses below 70 (sell).
- Exit: RSI crosses above 70 (sell); RSI crosses below 30 (buy); or based on a predetermined profit target or stop-loss.
- Momentum:
- Entry: RSI above 50 and rising (buy); RSI below 50 and falling (sell).
- Exit: RSI crosses below 50 (sell); RSI crosses above 50 (buy); or based on a predetermined profit target or stop-loss. A break of a recent support or resistance level can also signal an exit.
RSI Limitations and Considerations

RSI, while a powerful tool, isn’t a crystal ball. Relying solely on it for forex trading decisions can be risky, leading to losses if not used strategically alongside other indicators and robust risk management. Understanding its limitations is crucial for successful implementation.
RSI’s effectiveness hinges on the accurate interpretation of its signals. However, market noise and volatility can easily distort these readings, resulting in false signals that could lead to incorrect trading decisions. Furthermore, the RSI’s inherent limitations mean it shouldn’t be used in isolation.
Market Noise and False Signals
Market noise, characterized by random price fluctuations unrelated to underlying trends, significantly impacts RSI readings. These short-term price swings can cause the RSI to generate false buy or sell signals, leading traders astray. For example, a sharp, temporary price spike might push the RSI into overbought territory, triggering a sell signal, even though the underlying trend remains bullish. Conversely, a sudden dip could falsely signal a buying opportunity in a bearish market. Effective use of RSI necessitates filtering out this noise through a combination of techniques, such as confirming signals with other indicators or focusing on longer-term RSI trends.
Risk Management with RSI
Effective risk management is paramount when employing RSI in forex trading. Even with accurate signal interpretation, unforeseen market events can impact profitability. This includes setting appropriate stop-loss orders to limit potential losses on trades triggered by RSI signals. Furthermore, position sizing – determining the appropriate amount to invest in each trade – is crucial to manage risk effectively. For instance, a trader might allocate only 1-2% of their trading capital to a single trade based on an RSI signal, mitigating the impact of potential losses. Diversification across multiple currency pairs and trading strategies further enhances risk management.
Examples of False RSI Signals
Consider a scenario where a currency pair experiences a period of high volatility due to unexpected economic news. The RSI might fluctuate wildly, generating numerous buy and sell signals. A trader relying solely on these signals could end up entering and exiting trades frequently, incurring significant transaction costs and potentially losing money even if some individual trades were profitable. Another example involves a market consolidating within a tight range. The RSI might oscillate between overbought and oversold levels without a clear breakout, generating false signals that could lead to whipsaws and losses. In such situations, waiting for a clear break of the consolidation range, confirmed by other indicators, is a more prudent approach.
Practical Application and Examples
Let’s ditch the theory and dive into the real-world application of RSI in forex trading. We’ll explore how to use RSI to pinpoint potential entry and exit points, examine specific trade setups, and dissect both successful and unsuccessful trades to illustrate the nuances of RSI analysis. Remember, RSI is a tool, not a crystal ball; understanding its limitations is crucial for consistent profitability.
Hypothetical Forex Trade Setup Using RSI
Imagine we’re trading the EUR/USD pair. Our RSI settings are the standard 14-period. The price has been trending downwards, showing a clear bearish momentum. The RSI, however, is approaching the oversold region (below 30). This divergence between price action and RSI suggests a potential bullish reversal. We see a bullish candlestick pattern forming (e.g., a hammer or an inverted hammer) confirming this potential reversal. This is our entry signal. We would place a long position (buy order) expecting the price to bounce back. Our stop-loss order would be placed slightly below the low of the candlestick that triggered the entry signal, protecting against further downward movement. Our take-profit order could be set at a level based on prior support levels or a Fibonacci retracement level. If the RSI climbs back above 50 and the price breaks above a previous resistance level, we could consider increasing our take-profit target. If the RSI falls back below 30 before the price reaches our take-profit target, we may choose to take profits early or adjust our stop-loss order.
Successful Trade Case Study
Let’s say we entered a long position on EUR/USD when the RSI dipped to 28, accompanied by a bullish hammer candlestick. The price subsequently rallied, pushing the RSI above 70. We hit our take-profit target, securing a 1.5% profit. The chart would show a clear upward trend after our entry, with the RSI mirroring this positive momentum. The successful trade was characterized by a clear oversold condition on the RSI, confirmation from candlestick patterns, and a well-defined risk management plan.
Unsuccessful Trade Case Study
In another instance, we entered a short position (sell order) on GBP/USD based solely on the RSI crossing below 70, without confirming price action. The RSI subsequently bounced back, and the price moved against our position. We ended up hitting our stop-loss order, resulting in a small loss. The chart would likely show a continued upward trend, despite the initial RSI drop. The unsuccessful trade lacked confirmation from price action, highlighting the importance of integrating RSI with other technical indicators and a thorough understanding of market context.
Trade Case Study Summary, How to Use RSI in Forex Trading
| Trade | Pair | RSI Signal | Result |
|---|---|---|---|
| Successful | EUR/USD | Oversold (28), Bullish Hammer | 1.5% Profit |
| Unsuccessful | GBP/USD | RSI below 70 (lacking price confirmation) | Small Loss |
Advanced RSI Techniques
RSI, while seemingly straightforward, offers avenues for sophisticated application beyond basic overbought/oversold interpretations. Mastering these advanced techniques can significantly enhance your trading accuracy and risk management. This section explores methods to refine your RSI analysis and unlock its full potential.
RSI Smoothing Techniques Enhance Signal Clarity
Smoothing techniques applied to the RSI can help filter out market noise, resulting in clearer signals and reduced whipsaws. A common method involves calculating a moving average of the RSI itself. For example, applying a simple moving average (SMA) to a 14-period RSI can create a smoother indicator that reacts less dramatically to short-term price fluctuations. The choice of moving average period for smoothing depends on the trader’s preference and market volatility. A longer period SMA will produce a smoother line, but it will also lag behind the original RSI more. Conversely, a shorter period SMA will track the RSI more closely but will be more susceptible to noise.
RSI Period Selection and Market Context
Different market conditions benefit from different RSI periods. The standard 14-period RSI is a good starting point, offering a balance between sensitivity and smoothing. However, faster-moving markets might necessitate a shorter period, such as 9, to capture quicker price reversals. Conversely, slower, more trend-driven markets might benefit from a longer period, like 21, to filter out minor fluctuations and focus on larger trends. The choice of period is ultimately subjective and requires observation and backtesting to determine optimal settings for a specific market or trading style. For example, a highly volatile currency pair like GBP/JPY might be better analyzed with a 9-period RSI, while a less volatile pair like EUR/USD might perform better with a 14 or even 21-period RSI.
RSI Channels and Dynamic Support/Resistance
RSI channels or bands are created by plotting upper and lower boundaries around the RSI line. These boundaries can act as dynamic support and resistance levels. A common method involves drawing a channel based on the highest and lowest RSI values over a specified period. Breaks above the upper channel line could signal a strong uptrend, while breaks below the lower channel line could indicate a strong downtrend. The width of the channel can also provide insight into market volatility; wider channels suggest higher volatility, while narrower channels suggest lower volatility. For instance, imagine a currency pair’s RSI consistently trading within a channel between 30 and 70. A break above 70 could be interpreted as a strong bullish signal, suggesting further upward momentum, while a drop below 30 could signal a bearish reversal. It’s crucial to remember that these are not rigid levels, and the RSI, even within a channel, can still experience temporary fluctuations.
Final Conclusion
Mastering the RSI isn’t about finding the holy grail of forex trading; it’s about adding a powerful tool to your arsenal. By understanding its strengths and limitations, and combining it with sound risk management, you can significantly improve your trading decisions. Remember, consistent practice and a keen eye for market dynamics are key. So, dive in, learn the ropes, and start charting your course to forex success!
Essential FAQs
What are the common mistakes traders make when using RSI?
Over-reliance on RSI as the sole trading signal, ignoring other indicators and fundamental analysis, and failing to manage risk properly are common pitfalls.
How do I choose the optimal RSI period?
The standard 14-period RSI is a good starting point, but you might experiment with shorter (e.g., 9) or longer (e.g., 21) periods depending on market volatility and your trading style. Faster markets might benefit from shorter periods.
Can RSI predict market tops and bottoms?
RSI is not a crystal ball. While it can signal overbought and oversold conditions, it doesn’t guarantee market reversals. Use it in conjunction with other indicators and confirmation signals for better accuracy.
Is RSI suitable for all forex pairs?
Generally, yes, but its effectiveness can vary depending on the specific currency pair and market conditions. Some pairs might exhibit more reliable RSI signals than others.
Discover more by delving into Forex Scalping: What It Is and How to Profit further.
Discover how How to Analyze Forex News for Better Trading Decisions has transformed methods in this topic.


