How to Use the Average True Range (ATR) in Forex? Unlocking the secrets of this powerful indicator isn’t rocket science, but it does require understanding its core principles. This guide breaks down the Average True Range, showing you how to leverage it for smarter stop-losses, more calculated take-profits, and ultimately, better risk management in your forex trading. Prepare to tame the volatility beast!
We’ll cover everything from calculating ATR and interpreting its values to using it for position sizing and combining it with other indicators. Get ready to ditch those gut feelings and embrace data-driven decisions. By the end, you’ll be equipped to confidently navigate the forex market with ATR as your trusty sidekick.
Introduction to Average True Range (ATR) in Forex
Navigating the volatile world of Forex trading requires understanding not just price movements, but also the *volatility* of those movements. This is where the Average True Range (ATR) indicator comes in handy. It provides valuable insights into market price fluctuations, helping traders assess risk and manage their positions more effectively. Think of it as a speedometer for market volatility.
The Average True Range is a technical indicator that measures market volatility. It’s calculated using the average of the True Range (TR) over a specified number of periods, typically 14. The ATR doesn’t predict price direction; instead, it quantifies the typical price range within a given timeframe. This information is crucial for setting stop-loss orders, determining position size, and identifying potential breakouts.
Average True Range Calculation
The Average True Range calculation begins with determining the True Range for each period. The True Range is the greatest of the following three values:
Current High minus the current Low
Absolute value of Current High minus the previous Close
Absolute value of Current Low minus the previous Close
Once the True Range is calculated for each period, a moving average (usually a simple moving average) is applied to these values over the chosen number of periods (often 14). This moving average is the Average True Range.
Illustrative ATR Calculation
Let’s consider a simplified example. Suppose we have the following high, low, and close prices for three consecutive periods:
| Period | High | Low | Close |
|---|---|---|---|
| 1 | 1.1200 | 1.1180 | 1.1190 |
| 2 | 1.1210 | 1.1195 | 1.1205 |
| 3 | 1.1225 | 1.1200 | 1.1215 |
To calculate the True Range for period 2:
* High – Low = 1.1210 – 1.1195 = 0.0015
* |High – Previous Close| = |1.1210 – 1.1190| = 0.0020
* |Low – Previous Close| = |1.1195 – 1.1190| = 0.0005
The True Range for period 2 is 0.0020 (the highest value). Similarly, the True Range for period 3 would be calculated. After calculating the True Range for the desired number of periods (e.g., 14), a simple moving average is applied to these values to obtain the ATR. Note that the initial ATR calculation might require using the average of the first 14 periods’ True Ranges.
Understanding ATR Values and Volatility
The Average True Range (ATR) isn’t just a number; it’s a window into the soul of the forex market, revealing its temperament – calm or chaotic. Understanding how ATR values reflect volatility is crucial for effective trading. A higher ATR suggests a more volatile market, while a lower ATR indicates calmer conditions. This understanding directly impacts your risk management and trading strategy.
The relationship between ATR and market volatility is straightforward: higher ATR values correlate with increased price swings and greater volatility. Conversely, lower ATR values signal a less volatile market with smaller price fluctuations. This simple correlation allows traders to anticipate potential risk and adjust their strategies accordingly.
ATR and Risk Management
Traders use the ATR to gauge the expected price movement over a given period. This is invaluable for determining appropriate position sizing. For example, a trader might use the ATR to calculate a stop-loss order that’s a multiple of the ATR value. This ensures the stop-loss is placed at a level that accounts for the expected volatility. In a highly volatile market (high ATR), the stop-loss would be wider than in a less volatile market (low ATR). This approach helps control potential losses. By adjusting position size relative to the ATR, traders can manage their risk more effectively, limiting potential losses and maximizing potential profits. They might choose to take smaller positions in highly volatile markets to mitigate risk and larger positions in calmer markets where the risk is lower.
ATR Values and Their Implications
The following table provides a general guideline for interpreting ATR values and their implications for trading strategies. Remember that these are guidelines and specific values may vary depending on the timeframe and currency pair.
| ATR Value | Volatility Level | Trading Strategy Implications |
|---|---|---|
| Low (e.g., below 10 pips) | Low Volatility | Smaller stop-losses, potentially larger position sizes, focus on scalping or swing trading strategies. Expect smaller price movements. |
| Medium (e.g., 10-25 pips) | Moderate Volatility | Moderate stop-losses, balanced position sizing, adaptable strategies that can handle both trending and ranging markets. Price movements are more significant but still manageable. |
| High (e.g., above 25 pips) | High Volatility | Wider stop-losses, potentially smaller position sizes, focus on trend-following strategies or range trading with wider stop-loss levels. Expect larger and more rapid price swings. |
Using ATR for Stop-Loss and Take-Profit Levels
The Average True Range (ATR) isn’t just a volatility indicator; it’s a powerful tool for managing risk and setting realistic profit targets in your Forex trading. By using ATR multiples, you can objectively determine stop-loss and take-profit levels based on the inherent volatility of the currency pair you’re trading. This approach helps to maintain consistency and discipline in your trading strategy, reducing emotional decision-making.
Determining appropriate stop-loss and take-profit levels using ATR multiples involves multiplying the current ATR value by a chosen factor. This factor represents the number of average true ranges you’re willing to risk or target for profit. A higher multiple implies a wider stop-loss or take-profit range, reflecting a potentially higher risk or reward. The choice of multiple depends on your risk tolerance, trading style, and the specific market conditions.
ATR Multiples for Stop-Loss and Take-Profit Orders
Let’s illustrate how to practically apply ATR multiples to set stop-loss and take-profit orders. Suppose the current ATR for the EUR/USD pair is 0.0070. A trader might choose a 1x ATR stop-loss, placing their stop-loss order 0.0070 pips below their entry point. For a take-profit, they might use a 2x ATR target, placing their take-profit order 0.0140 pips (2 x 0.0070) above their entry point. This strategy offers a risk-reward ratio of 1:2, meaning the potential profit is double the potential loss. Conversely, a more conservative trader might opt for a 1x ATR stop-loss and a 1x ATR take-profit, resulting in a 1:1 risk-reward ratio.
Example ATR Multiple Strategies and Risk/Reward Profiles
The selection of ATR multiples directly impacts the risk and reward associated with each trade. A higher multiple for the take-profit increases potential profits but also extends the holding period, exposing the trade to more market fluctuations. Conversely, a lower multiple reduces potential profits but also limits potential losses. Understanding this relationship is crucial for effective risk management.
| ATR Multiple Strategy | Stop-Loss | Take-Profit | Risk/Reward Ratio |
|---|---|---|---|
| Conservative | 1x ATR | 1x ATR | 1:1 |
| Balanced | 1x ATR | 2x ATR | 1:2 |
| Aggressive | 1x ATR | 3x ATR | 1:3 |
| Very Aggressive (High Risk) | 0.5x ATR | 2x ATR | 1:4 |
Remember that these are examples, and the optimal ATR multiples will vary depending on individual trading styles, risk tolerance, and market conditions. It’s crucial to backtest different strategies to determine what works best for you. Always remember that no strategy guarantees profits, and losses are a part of trading. Consistent application of risk management techniques, such as using ATR-based stop-losses, is vital for long-term success.
ATR and Position Sizing
Determining the right position size is crucial in Forex trading; it’s about managing risk effectively and preventing significant losses. The Average True Range (ATR) offers a powerful tool to help you achieve this, providing a measure of market volatility that directly impacts your risk assessment. By incorporating ATR into your position sizing strategy, you can tailor your trades to the current market conditions, optimizing your risk-reward ratio.
Understanding how ATR relates to position sizing hinges on the principle that higher volatility (higher ATR) generally means wider price swings, increasing the potential for larger losses (or gains). Therefore, in more volatile markets, you’ll generally want to take smaller positions to limit potential losses, and vice versa.
ATR-Based Position Sizing Calculation
This section details how to calculate your position size using the ATR and your risk tolerance. The core idea is to define your acceptable risk in terms of a percentage of your trading account and then use the ATR to determine the appropriate number of units to trade.
Let’s assume you have a $10,000 trading account, a risk tolerance of 1%, and an ATR of 15 pips. Your maximum acceptable loss is therefore $100 (1% of $10,000). If you plan to use a stop-loss order of 1 ATR (15 pips), you’ll need to determine how many units you can trade while keeping your potential loss within $100.
This requires knowing the pip value of your chosen currency pair. For example, if 1 pip is worth $1 for your pair, then you could trade 6.67 units (approximately 7 units, to maintain a whole number of units). The potential loss would then be approximately $105 (15 pips x 7 units x $1/pip), slightly exceeding your 1% risk tolerance, which highlights the importance of rounding down for conservative risk management.
To calculate position size: (Account Risk Percentage * Account Balance) / (Stop Loss in Pips * Pip Value) = Position Size
Alternative Position Sizing Methods Using ATR
Several other methods incorporate ATR for position sizing, each with its strengths and weaknesses. One common approach is to use a fixed ATR multiple for your stop-loss. For example, you might consistently use a 2 ATR stop-loss, adjusting your position size accordingly. This offers consistency, but requires careful monitoring of market volatility and adjustment of position size based on ATR fluctuations. Another approach is to adjust the risk percentage based on ATR values – higher ATR, lower risk percentage.
Step-by-Step Guide to Calculating Position Size Using ATR
- Determine your risk tolerance: Decide what percentage of your account you’re willing to risk on each trade (e.g., 1%, 2%).
- Calculate your maximum loss: Multiply your risk tolerance by your account balance.
- Determine your stop-loss level: Decide how many ATRs you’ll use for your stop-loss (e.g., 1 ATR, 2 ATR). Multiply this by the current ATR value.
- Calculate the pip value: Determine the value of one pip for your chosen currency pair.
- Calculate your position size: Use the formula: (Maximum Loss) / (Stop Loss in Pips * Pip Value) = Position Size. Always round down to the nearest whole number to maintain conservative risk management.
Combining ATR with Other Indicators: How To Use The Average True Range (ATR) In Forex
The Average True Range (ATR) is a powerful tool for gauging market volatility, but its effectiveness can be significantly amplified when combined with other technical indicators. By integrating ATR with indicators that identify potential entry and exit points, traders can create robust strategies that optimize risk management and capitalize on market fluctuations. This synergistic approach provides a more holistic view of market dynamics, leading to more informed and potentially profitable trading decisions.
Combining ATR with other indicators allows for a more nuanced understanding of price action and volatility. Instead of relying solely on volatility to inform trading decisions, traders can use other indicators to confirm potential trade setups and manage risk more effectively. This multi-faceted approach reduces reliance on any single indicator, thus mitigating the risk associated with false signals.
ATR and Moving Averages
The combination of ATR and moving averages is a classic example of a powerful trading strategy. Moving averages, such as the simple moving average (SMA) or exponential moving average (EMA), provide a measure of the underlying trend. By combining this trend information with the volatility information provided by ATR, traders can identify high-probability setups where the trend and volatility align. For instance, a strong uptrend (confirmed by a moving average) coupled with high volatility (indicated by a high ATR) might suggest a continuation of the uptrend, offering a favorable risk-reward ratio for long positions. Conversely, a downtrend with high volatility could indicate a shorting opportunity. Traders can use the ATR to set appropriate stop-loss levels, ensuring their risk is managed effectively within the context of the prevailing volatility. A common strategy involves using the ATR to set a trailing stop-loss, adjusting the stop-loss level based on the prevailing volatility.
ATR and RSI
The Relative Strength Index (RSI) is a momentum indicator that measures the speed and change of price movements. Combining ATR with RSI allows traders to identify periods of high volatility during overbought or oversold conditions. A high RSI value (above 70) might suggest an overbought market, but the presence of a high ATR could indicate that the uptrend might continue despite the overbought condition. Conversely, a low RSI (below 30) might suggest an oversold market, but a high ATR could signify that the downtrend might continue despite the oversold condition. This combination allows traders to identify potentially strong breakouts or reversals based on both momentum and volatility. A trader might, for example, wait for a bearish divergence (RSI making lower highs while price makes higher highs) combined with a high ATR to initiate a short position, anticipating a potential trend reversal within a volatile market.
Comparing ATR Combinations
Different combinations of ATR with other indicators offer unique advantages and disadvantages. The ATR and moving average combination provides a straightforward approach to identifying trend-following opportunities, particularly useful in trending markets. The ATR and RSI combination, however, is better suited for identifying potential reversals or breakouts in volatile markets. The choice of combination depends on the trader’s trading style, risk tolerance, and market conditions. For example, a conservative trader might prefer the ATR and moving average combination for its focus on trend confirmation, while a more aggressive trader might favor the ATR and RSI combination for its potential to capture high-volatility breakouts. The key is to understand the strengths and limitations of each combination and to adapt the strategy based on market dynamics.
ATR and Different Timeframes
The Average True Range (ATR) isn’t a one-size-fits-all indicator. Its effectiveness hinges heavily on the timeframe you choose to analyze. Understanding how the ATR behaves across different timeframes is crucial for tailoring your trading strategies and maximizing your results. Essentially, the timeframe you select directly impacts the volatility you’re measuring, and therefore, your trading decisions.
The ATR value significantly changes depending on the timeframe you’re using. On a 15-minute chart, you’ll see a much smaller ATR than on a daily chart. This is because shorter timeframes capture smaller price swings, resulting in lower volatility readings. Conversely, daily or weekly charts reflect larger price movements and therefore higher ATR values. This difference stems from the nature of volatility itself – shorter-term price fluctuations are generally less dramatic than longer-term trends.
ATR Values Across Timeframes, How to Use the Average True Range (ATR) in Forex
Using different timeframes alters the interpretation of ATR values. A 14-period ATR of 10 pips on a 15-minute chart signifies considerably less volatility than a 14-period ATR of 10 pips on a daily chart. On the 15-minute chart, this 10-pip range represents a relatively significant price swing within a short period, suggesting potentially choppy trading conditions. However, on a daily chart, a 10-pip ATR would indicate a much calmer market environment, with smaller daily price fluctuations. This difference highlights the importance of considering the timeframe when setting stop-losses, take-profits, or position sizes based on the ATR.
Implications for Trading Strategies
The timeframe choice dictates the style of trading best suited for using the ATR. Scalpers, focusing on very short-term trades (e.g., 5-15 minute charts), would use a much smaller ATR value for their stop-loss and take-profit levels than a swing trader working with daily or weekly charts. A scalper might use a 10-pip stop-loss based on a 5-minute ATR, while a swing trader might use a 50-pip stop-loss based on a daily ATR. This difference reflects the different risk tolerances and trading horizons of these strategies. The shorter the timeframe, the more frequent the trades, and the smaller the potential profit (and loss) per trade.
Optimal Timeframe Selection
There’s no single “best” timeframe for using the ATR. The optimal timeframe depends entirely on your trading style, risk tolerance, and goals. Day traders might find the 1-hour or 4-hour chart most suitable, allowing them to manage trades throughout the trading day. Swing traders, holding positions for several days or weeks, might prefer the daily or weekly charts. Long-term investors may not even utilize the ATR directly, instead focusing on longer-term trend analysis. The key is to choose a timeframe that aligns with your trading strategy and the volatility you’re comfortable managing.
Practical Examples of ATR Across Timeframes
Let’s imagine we’re trading EUR/USD. On a 15-minute chart, the 14-period ATR might be 5 pips. A trader using this timeframe might set a stop-loss of 10 pips (2x ATR) and a take-profit of 15 pips (3x ATR). On the daily chart, however, the 14-period ATR might be 30 pips. The same trader, now employing a swing trading strategy, might use a stop-loss of 60 pips (2x ATR) and a take-profit of 90 pips (3x ATR). Notice how the stop-loss and take-profit levels adjust proportionally to the ATR value on each timeframe, reflecting the different levels of volatility and trading horizons. This demonstrates the adaptive nature of ATR application across various timeframes.
Limitations of Using ATR
The Average True Range, while a powerful tool, isn’t a magic bullet. Like any indicator, it has limitations that traders need to understand to avoid misinterpretations and potentially costly mistakes. Blindly following ATR signals without considering other market factors can lead to losses. This section explores these limitations and offers strategies for mitigating their impact.
ATR primarily reflects volatility, not direction. A high ATR suggests increased price swings, but it doesn’t indicate whether the price will move up or down. This means ATR alone can’t predict the market’s direction, making it crucial to combine it with other indicators or analysis techniques for a more comprehensive trading strategy. Relying solely on ATR for trading decisions can be risky.
ATR and Market Regime Changes
The effectiveness of ATR can be significantly impacted by shifts in market regimes. During periods of low volatility, the ATR might underestimate potential price swings, leading to stop-losses that are too tight and prematurely triggering exits. Conversely, in highly volatile markets, the ATR might lag behind the actual price action, resulting in stop-losses that are too wide, limiting profitability. For example, a sudden spike in volatility due to unexpected news could cause the ATR to adjust slowly, leaving your trades vulnerable to larger-than-expected price movements. Adapting your ATR-based strategy to different market conditions is crucial.
Limitations in Trending Markets
In strong trending markets, the ATR can be less effective in determining appropriate stop-loss levels. A consistently trending market will often exhibit higher volatility than a range-bound market, resulting in a larger ATR value. However, this larger value might not accurately reflect the risk involved in a position, as the trend’s momentum can easily exceed the ATR-based stop-loss level. A trader might experience a series of whipsaws in a trending market even with appropriate stop losses based on ATR, resulting in multiple stop-out events. This can be especially true during periods of high momentum, where a rapid price movement can easily exceed the predicted range.
Lagging Indicator Nature of ATR
ATR is a lagging indicator, meaning it reflects past volatility rather than predicting future volatility. This lag can be particularly problematic in rapidly changing market conditions. For instance, if volatility suddenly increases, the ATR might not immediately reflect this change, potentially leaving traders exposed to unexpected price swings. To mitigate this, traders can consider using shorter-period ATR values to react more quickly to changing volatility. However, shorter periods introduce more noise and may lead to more frequent stop-loss triggers.
False Signals and Misleading Interpretations
While ATR provides valuable insights into volatility, it’s essential to remember it doesn’t predict price movements. High ATR values might lead traders to believe that substantial price changes are imminent, but this isn’t always the case. The market might consolidate or move in an unexpected direction, leading to losses despite the high ATR. Similarly, low ATR values don’t guarantee a lack of price movement. A sudden news event could trigger a significant price swing even in a historically low-volatility environment. Consider a scenario where a major economic announcement causes a significant price jump despite a low ATR reading just before the news. The ATR would not have predicted this sharp movement.
Visual Representation of ATR
The Average True Range (ATR) isn’t directly plotted as a price on your chart like, say, the closing price. Instead, it’s usually represented as a separate indicator, often displayed as a line above or below the price chart. Understanding how this line moves in relation to the price candles helps you visualize market volatility and make informed trading decisions.
This visual representation offers a dynamic snapshot of market conditions. A rising ATR line indicates increasing volatility, while a falling ATR suggests decreasing volatility. This visual cue allows traders to quickly assess market sentiment and adjust their trading strategies accordingly.
ATR Line on a Chart
The ATR line itself is typically smooth, showing an average over the selected period (e.g., 14 periods). It doesn’t follow the sharp price fluctuations but rather reflects the average range of price movement over time. Imagine it as a rolling average of the true range, smoothing out the daily highs and lows. Charting platforms often allow customization of the ATR’s color and line thickness for better visibility. You’ll see it displayed alongside your price candles (e.g., candlestick or bar chart) and other technical indicators.
Interpreting ATR Values on Charting Platforms
Most trading platforms display the ATR value numerically, usually in the indicator window alongside the line itself. This numerical value represents the average true range for the specified period. For example, an ATR value of 10 might mean that, on average, the price moves 10 pips (or points, depending on the asset) per period. A higher ATR value suggests higher volatility, implying potentially larger price swings. Conversely, a lower ATR value indicates lower volatility, meaning smaller price movements. Keep in mind that the ATR’s numerical value is highly dependent on the chosen timeframe; a 14-period ATR on a daily chart will differ significantly from a 14-period ATR on a 5-minute chart.
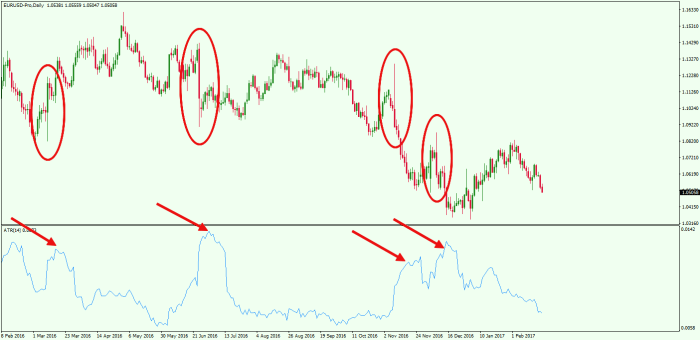
Example Chart Illustrating ATR and Price Action
Let’s envision a candlestick chart showing the EUR/USD pair over a week. The price candles show significant price fluctuations, some days exhibiting large price swings (long candles), and others with smaller movements (short candles). Overlayed on this chart is the 14-period ATR line. During periods of high volatility, where the candles are long and the price action is erratic, the ATR line rises, reflecting the increased average true range. Conversely, during periods of consolidation or sideways trading, where the candles are shorter and the price action is less dramatic, the ATR line falls, indicating a decrease in average true range and volatility. The ATR line acts as a visual guide, showcasing the overall volatility trend alongside the actual price movement, helping traders understand the context of the price action. For instance, a large price move during a period of high ATR is less surprising than a similar price move during a period of low ATR. This visual representation helps traders contextualize price fluctuations within the broader volatility picture.
Conclusion
Mastering the Average True Range isn’t just about knowing the formula; it’s about understanding its implications for your trading strategy. By incorporating ATR into your decision-making process – from setting stop-losses and take-profits to determining optimal position sizes – you’ll significantly improve your risk management and boost your chances of consistent profitability. Remember, consistent application and understanding market context are key to unlocking ATR’s full potential. So, start charting your course to forex success today!
General Inquiries
What are the common mistakes traders make when using ATR?
Over-reliance on ATR without considering other market factors, using a single ATR multiple for all trades regardless of market conditions, and failing to adjust ATR settings based on different timeframes are common pitfalls.
Can I use ATR for scalping?
Yes, but you’ll likely use shorter timeframes and smaller ATR multiples. The shorter the timeframe, the more noise you’ll encounter, requiring careful interpretation.
How does ATR differ from other volatility indicators?
While other indicators measure volatility, ATR focuses specifically on price range, providing a more direct measure of price movement regardless of the direction. This makes it unique in its application to stop-loss and take-profit levels.
Is ATR a leading or lagging indicator?
ATR is generally considered a lagging indicator, as it reflects past price volatility. However, its predictive power lies in using past volatility to anticipate future potential price swings.
Do not overlook the opportunity to discover more about the subject of The Pros and Cons of Trading Forex Full-Time.
Obtain access to The Impact of Geopolitics on Forex Trading to private resources that are additional.


