How to Use Moving Averages in Forex Trading? Sounds boring, right? Wrong! Mastering moving averages isn’t about crunching numbers; it’s about unlocking the secrets hidden within price charts. This guide dives deep into the world of SMAs, EMAs, and WMAs, showing you how these powerful tools can transform your forex trading game. Prepare to ditch the guesswork and embrace data-driven decisions that’ll have you saying “cha-ching!”
We’ll unravel the mysteries of different moving average types, their strengths and weaknesses, and how to use them to spot trends, identify support and resistance levels, and ultimately, make smarter trades. We’ll cover everything from basic calculations to advanced strategies, ensuring you’re equipped to navigate the forex market with confidence. Get ready to level up your trading skills!
Introduction to Moving Averages in Forex
Navigating the volatile world of Forex trading can feel like trying to decipher a cryptic code. Luckily, tools exist to help simplify the complexities and provide a clearer picture of price trends. One such powerful tool is the moving average, a fundamental indicator used by traders of all levels to identify potential entry and exit points. This guide will demystify moving averages and show you how they can enhance your trading strategy.
Moving averages smooth out price fluctuations, revealing underlying trends by averaging prices over a specific period. Imagine a rollercoaster – the raw price data is the chaotic up-and-down motion, while the moving average is a smoother line that represents the overall direction of the ride. This smoothing effect helps filter out the “noise” of short-term price swings, allowing traders to focus on the bigger picture. The concept has been around for quite some time, with its origins tracing back to the early days of technical analysis, finding widespread adoption in the 20th century as computational power became more readily available. The application of moving averages in finance evolved alongside the development of charting software and trading platforms, making it an indispensable tool for modern-day traders.
Types of Moving Averages
There are several types of moving averages, each with its own strengths and weaknesses. The choice of which to use often depends on the trader’s individual trading style and the timeframe they are analyzing. The most common types are Simple Moving Averages (SMA), Exponential Moving Averages (EMA), and Weighted Moving Averages (WMA).
Simple Moving Average (SMA)
The SMA is calculated by adding the closing prices of a security over a specified period and then dividing by the number of periods. For example, a 10-day SMA would sum the closing prices of the last 10 days and divide by 10. The simplicity of this calculation makes it easy to understand and implement, however, it gives equal weight to all data points, meaning older data points have the same influence as more recent ones. This can make it less responsive to recent price changes compared to other types of moving averages. A common use of the SMA is to identify support and resistance levels, where the price tends to bounce off the moving average line.
Exponential Moving Average (EMA)
Unlike the SMA, the EMA gives more weight to recent prices. This makes it more responsive to recent price changes, providing a potentially quicker indication of trend reversals. The calculation involves a smoothing factor, which determines the weighting given to recent prices. A higher smoothing factor gives more weight to recent prices, making the EMA more sensitive. Traders often use EMAs in conjunction with SMAs to identify crossover signals, which can signal potential buying or selling opportunities. For instance, a bullish crossover occurs when a short-term EMA crosses above a long-term EMA, suggesting a potential uptrend.
Weighted Moving Average (WMA)
The WMA allows traders to assign different weights to each data point, giving more significance to more recent prices. This allows for greater flexibility in customizing the sensitivity of the moving average to recent price changes. The weights are assigned according to a specific weighting scheme, with more recent prices typically receiving higher weights. The choice of weighting scheme can be tailored to the trader’s specific needs and preferences, making it a versatile tool for those seeking fine-grained control over the sensitivity of their moving average.
Types of Moving Averages
Moving averages are fundamental tools in forex trading, smoothing out price fluctuations to reveal underlying trends. Different types of moving averages offer unique perspectives on price action, each with its own strengths and weaknesses. Understanding these differences is crucial for selecting the right tool for your trading strategy.
Simple Moving Average (SMA)
The Simple Moving Average is calculated by summing the closing prices of a specified number of periods and dividing by the number of periods. It’s the most straightforward moving average type. For example, a 10-day SMA adds the closing prices of the last 10 days and divides the result by 10. This provides a simple, easily understood average price over that period. The formula is:
SMA = (Sum of Closing Prices over n periods) / n
where ‘n’ represents the number of periods. SMAs are easily understood but can be slow to react to new price changes, resulting in a significant lag. This lag can lead to missed entry or exit points. However, their simplicity makes them a good starting point for beginners.
Exponential Moving Average (EMA)
Unlike the SMA, the Exponential Moving Average gives more weight to recent prices. This makes it more responsive to recent price changes compared to the SMA. The calculation involves a smoothing factor (which is determined by the number of periods) and the previous day’s EMA. The formula is a bit more complex:
EMA = (Closing Price x Multiplier) + (Previous EMA x (1 – Multiplier))
where the Multiplier = 2 / (n + 1), and ‘n’ is the number of periods. The higher the value of ‘n’, the lower the multiplier, leading to less responsiveness. EMAs are preferred by many traders for their sensitivity to recent price movements, making them potentially more suitable for short-term trading strategies. However, their increased responsiveness can also lead to more false signals.
Weighted Moving Average (WMA)
The Weighted Moving Average assigns different weights to each closing price within the selected period. Recent prices receive higher weights, making it more responsive than the SMA but less so than the EMA. The weights are typically assigned in a descending order, giving the most recent price the highest weight and the oldest price the lowest weight. The formula involves assigning weights (wi) to each closing price (Ci):
WMA = Σ (wi * Ci) / Σ wi
where ‘i’ represents each period within the selected range. The choice of weights can be customized; however, a common method is to assign weights proportionally to the period number. For example, a 5-period WMA might assign weights of 5, 4, 3, 2, and 1 to the most recent to the oldest prices, respectively. WMAs offer a balance between responsiveness and smoothing, making them a versatile option for various trading strategies. However, the complexity of assigning weights can be a drawback.
Comparison of Moving Averages
| Characteristic | SMA | EMA | WMA |
|---|---|---|---|
| Responsiveness | Low | High | Medium |
| Lag | High | Low | Medium |
| Smoothing Effect | High | Medium | Medium |
| Calculation Complexity | Low | Medium | Medium |
Using Moving Averages for Trend Identification
Moving averages are powerful tools for identifying trends in Forex trading. By smoothing out price fluctuations, they help traders discern the underlying direction of the market, reducing the noise and focusing on the bigger picture. This allows for more informed decisions about entering and exiting trades, potentially improving profitability. Understanding how to interpret moving average signals is key to successful implementation.
Moving averages help identify trends primarily through crossovers and trend confirmation. A crossover occurs when one moving average intersects another, signaling a potential trend change. Confirmation of an existing trend involves observing the price action in relation to the moving average(s), providing additional confidence in the trend’s strength and longevity.
Moving Average Crossovers and Trend Identification
A simple moving average crossover strategy involves using two moving averages of different lengths. A common setup uses a short-term moving average (e.g., 10-period) and a long-term moving average (e.g., 50-period). When the short-term moving average crosses above the long-term moving average, it’s considered a bullish signal, suggesting an uptrend. Conversely, a cross below indicates a bearish signal, suggesting a downtrend. The effectiveness of this strategy depends on the chosen periods and the market conditions. For instance, a fast crossover (e.g., 5-period and 20-period) will generate more signals, some of which may be false. A slower crossover (e.g., 200-period and 50-period) will provide fewer, potentially more reliable signals.
Using Moving Averages to Confirm Existing Trends
Moving averages can be used to confirm trends already identified through other technical analysis methods. For example, if the price is making higher highs and higher lows (a clear uptrend), the presence of a rising moving average reinforces the bullish sentiment. Similarly, if the price is making lower highs and lower lows (a clear downtrend), a falling moving average provides confirmation of the bearish trend. A price consistently above a moving average during an uptrend or below during a downtrend suggests a strong and sustained trend.
Examples of Successful and Unsuccessful Trend Identification
It’s crucial to understand that moving averages are not perfect indicators. They can generate false signals, especially in ranging markets or during periods of high volatility.
- Successful Trend Identification: Imagine a scenario where the price of EUR/USD is steadily rising, forming higher highs and higher lows. A 20-period moving average is consistently rising above a 50-period moving average, and the price remains comfortably above both. This provides strong confirmation of an established uptrend.
- Unsuccessful Trend Identification: In a sideways or ranging market, the moving averages might generate numerous crossover signals, many of which are false. The price might fluctuate above and below the moving averages without establishing a clear trend. A trader relying solely on these signals would likely experience frequent losses.
- Another Successful Example: Consider GBP/USD experiencing a sharp decline. Both a 10-period and a 20-period moving average are falling, with the price consistently trading below them. This clearly signals a strong downtrend.
- Another Unsuccessful Example: A sudden news event, like an unexpected interest rate hike, can cause a sharp price reversal, invalidating any trend identified by moving averages. The moving averages might lag behind the price action, leading to missed opportunities or losses.
Moving Average Strategies
Moving averages are powerful tools, but their true potential is unleashed when combined with other indicators or employed within sophisticated trading strategies. Understanding these combinations and strategies allows for more nuanced market analysis and improved trade execution. This section explores some effective approaches.
Moving Averages and Other Technical Indicators
Combining moving averages with other technical indicators like the Relative Strength Index (RSI) and the Moving Average Convergence Divergence (MACD) can significantly enhance trading signals. For example, using a 20-period moving average alongside the RSI can help confirm overbought or oversold conditions. A bullish crossover on the moving average coupled with an RSI reading above 70 might suggest a strong upward trend, although caution is warranted as this isn’t a guaranteed signal. Similarly, a bearish crossover combined with an RSI below 30 could signal a potential downward trend, again requiring confirmation from other indicators or price action. The MACD, which measures momentum, can be used to confirm the direction of a moving average crossover. A bullish crossover on the moving average accompanied by a bullish MACD histogram might strengthen the buy signal. Conversely, a bearish crossover on the moving average with a bearish MACD histogram could bolster a sell signal. Remember, relying solely on any single indicator is risky; confirmation from multiple sources is key.
Moving Average Crossover Strategy
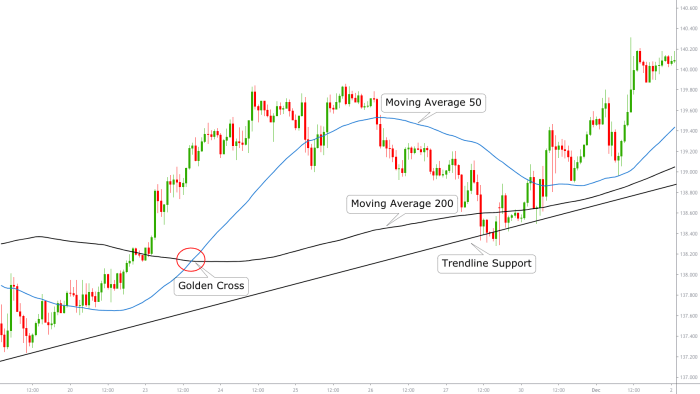
The moving average crossover strategy is a classic and relatively simple technique. It involves using two moving averages of different periods, typically a short-term and a long-term average. A buy signal is generated when the shorter-term moving average crosses above the longer-term moving average (a “golden cross”), suggesting a potential uptrend. Conversely, a sell signal is generated when the shorter-term moving average crosses below the longer-term moving average (a “death cross”), indicating a potential downtrend. For instance, a trader might use a 50-period moving average and a 200-period moving average. When the 50-period MA crosses above the 200-period MA, it’s a buy signal; when the 50-period MA crosses below the 200-period MA, it’s a sell signal. This strategy works best in trending markets, but can generate false signals in sideways or choppy markets.
Moving Average Ribbon Strategy
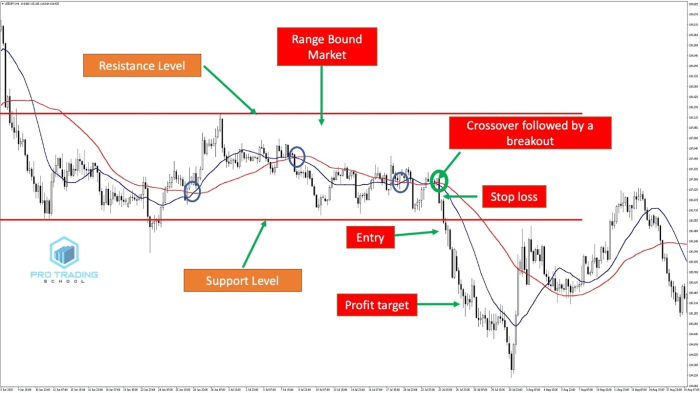
The moving average ribbon strategy utilizes multiple moving averages of varying periods to gauge momentum and trend strength. By visually observing the convergence and divergence of these averages, traders can identify potential trend changes and momentum shifts. A tightening of the ribbon suggests a potential breakout, while a widening ribbon might indicate a period of consolidation or indecision. For example, a trader might use a ribbon composed of 5, 10, 15, 20, and 50-period moving averages. When these averages are closely bunched together, it could indicate a period of low volatility. A sudden divergence, where the averages spread out significantly, may signal a strong trend developing. The interpretation of ribbon signals requires practice and experience, as they can be less definitive than a simple crossover strategy.
Implementing a Moving Average Crossover Strategy: A Step-by-Step Guide
Here’s a step-by-step guide to implementing the moving average crossover strategy using a 50-period and 200-period moving average:
- Choose your timeframe: Select a timeframe for your chart (e.g., daily, 4-hour, 1-hour). The timeframe influences the sensitivity of the strategy.
- Select your moving averages: Apply a 50-period and a 200-period simple moving average (SMA) to your chosen chart.
- Identify the crossover: Observe the chart for instances where the 50-period SMA crosses above the 200-period SMA (golden cross) or below it (death cross).
- Place your trade: When a golden cross occurs, consider a long position (buy). When a death cross occurs, consider a short position (sell).
- Set your stop-loss and take-profit levels: Always use stop-loss orders to limit potential losses and take-profit orders to secure profits. These levels should be determined based on your risk tolerance and market conditions.
- Monitor your trade: Regularly monitor your trade and adjust your stop-loss and take-profit levels as needed, based on changing market conditions.
- Manage your risk: Never risk more capital than you can afford to lose. Proper risk management is crucial in forex trading.
Support and Resistance Levels with Moving Averages
Moving averages, while primarily used for trend identification, can also act as dynamic support and resistance levels in forex trading. This means that the price of a currency pair often bounces off these average lines, creating potential trading opportunities. Understanding how moving averages function in this capacity is crucial for developing robust trading strategies.
Moving averages provide dynamic support and resistance because they represent the average price over a specific period. When the price approaches a moving average, it can encounter buying or selling pressure, causing it to reverse direction. This is because traders often use moving averages as signals to enter or exit trades. For example, a price approaching a 20-day moving average from below might trigger buy orders from traders who anticipate a price increase, thus providing support. Conversely, a price approaching the same moving average from above might trigger sell orders, leading to resistance. The effectiveness of a moving average as support or resistance depends on several factors, including the timeframe used, the type of moving average, and the overall market conditions.
Price Bounces Off Moving Averages
Imagine a scenario where the price of EUR/USD is steadily declining. However, as it approaches its 50-day moving average, buying pressure increases. The price might stall, consolidate, and then reverse its downward trend, bouncing off the moving average. This bounce could be interpreted as a potential buy signal, indicating a possible short-term upward trend. Conversely, if the price is trending upwards and approaches its 200-day moving average, selling pressure might increase, causing a temporary reversal or a slowdown in the uptrend. The price may then consolidate before continuing its upward movement or reversing altogether. This would be interpreted as a potential area of resistance. The strength of the bounce will depend on several factors, including volume and the overall market sentiment. A strong bounce with high volume would be a more reliable signal than a weak bounce with low volume.
Limitations of Moving Averages as Support and Resistance
While moving averages can be valuable tools for identifying potential support and resistance levels, it’s crucial to acknowledge their limitations. They are not foolproof indicators and can fail to act as support or resistance. False breakouts are common, where the price appears to break through the moving average but then reverses. This can lead to significant losses if traders rely solely on moving averages for entry and exit signals. Additionally, the effectiveness of a moving average as support or resistance can vary depending on market volatility. During periods of high volatility, the price might easily break through a moving average without much resistance. Therefore, it’s essential to combine moving average analysis with other technical indicators and fundamental analysis to confirm trading signals and reduce risk. Over-reliance on any single indicator, including moving averages, can lead to flawed trading decisions.
Choosing the Right Moving Average Period
Picking the perfect moving average period isn’t about finding a magic number; it’s about aligning your strategy with market behavior and your personal trading style. The right period depends heavily on several key factors, and understanding these is crucial for consistent results. Think of it like choosing the right tool for the job – a hammer won’t cut wood, and a saw won’t drive in a nail.
The selection of an appropriate moving average period hinges on the interplay between the timeframe you’re trading, your preferred trading style, and the volatility of the market you’re observing. Short-term moving averages react quickly to price changes, while long-term moving averages offer a smoother, more delayed response. This difference dramatically impacts your trading decisions and risk profile.
Timeframe and Moving Average Period
The timeframe of your chart directly influences the appropriate moving average period. For example, a 10-period moving average on a 1-minute chart will be far more reactive than a 10-period moving average on a daily chart. On shorter timeframes like 5-minute or 15-minute charts, traders often utilize shorter-period moving averages (e.g., 5, 10, 20 periods) to capture quick price movements and capitalize on short-term trends. Conversely, longer timeframes such as daily or weekly charts often benefit from longer-period moving averages (e.g., 50, 100, 200 periods) to identify broader trends and filter out noise. Imagine trying to navigate a busy city street using a map designed for a cross-country road trip – it wouldn’t be very effective.
Trading Style and Moving Average Period, How to Use Moving Averages in Forex Trading
Your trading style plays a crucial role. Scalpers, who aim for quick profits from small price changes, will naturally prefer shorter-period moving averages to react swiftly to market fluctuations. Swing traders, on the other hand, might use longer-period moving averages to identify longer-term trends and hold positions for several days or weeks. Day traders might fall somewhere in between, using a combination of short and medium-term moving averages to capitalize on intraday price swings while managing risk effectively. Think of it as choosing a car – a sports car for quick maneuvers, an SUV for longer journeys, and a pickup truck for hauling heavy loads.
Market Volatility and Moving Average Period
High volatility markets, characterized by rapid and significant price swings, often require shorter-period moving averages to react to the dynamic price changes. However, these shorter periods might also lead to more false signals. In less volatile markets, longer-period moving averages can provide smoother signals and reduce the likelihood of whipsaws. For instance, during periods of high uncertainty or significant news events, shorter-term averages might be overwhelmed by noise, whereas longer-term averages might still provide a clearer picture of the underlying trend. The analogy here is like adjusting your sailing strategy depending on the weather – you’d want a more responsive boat in a storm than in calm seas.
Determining Optimal Moving Average Period
A practical strategy for determining the optimal moving average period involves backtesting different periods on historical data. By analyzing the performance of various moving average combinations (e.g., a 20-period and a 50-period moving average) across different market conditions, traders can identify the periods that consistently generate profitable signals for their chosen trading style. This process helps refine the strategy and fine-tune the parameters for optimal performance. For example, a trader might backtest a 10-period and 20-period moving average crossover strategy on the EUR/USD pair over the past five years, adjusting the periods based on the results to find the combination that yields the highest win rate and Sharpe ratio. This empirical approach ensures the chosen periods are data-driven and tailored to the specific market and trading style.
Limitations and Risks of Using Moving Averages: How To Use Moving Averages In Forex Trading
Moving averages, while a powerful tool in forex trading, aren’t a crystal ball. Relying solely on them for trading decisions can lead to significant losses if you don’t understand their inherent limitations and potential pitfalls. This section explores these crucial aspects, helping you navigate the complexities of using moving averages effectively and responsibly.
The primary issue with relying solely on moving averages is their inherent lag. Because they smooth out price action, they often react to price changes *after* they’ve already occurred. This delay can mean missing entry points on strong trends or getting caught in whipsaws – sudden and sharp price reversals that can wipe out profits quickly. Furthermore, moving averages can generate false signals, leading traders to enter trades that ultimately result in losses. The effectiveness of moving averages also depends heavily on market conditions; in highly volatile markets, they can be less reliable than in calmer, trend-following environments.
Find out about how How to Choose the Best Forex Trading Strategy can deliver the best answers for your issues.
Whipsaws and False Signals
Whipsaws are a common problem when using moving averages, particularly in sideways or ranging markets. These are instances where the price repeatedly crosses the moving average, generating buy and sell signals that quickly reverse. A trader following these signals blindly could experience significant losses due to repeated entry and exit points, all resulting in minimal profit or even net losses. False signals, similarly, occur when the moving average suggests a trend reversal that doesn’t materialize, again leading to incorrect trade entries and potential losses. For example, a breakout above a moving average might be interpreted as a bullish signal, but if the price subsequently retraces sharply, the trader would experience a loss. This can be particularly frustrating in markets characterized by consolidation or indecision.
Risk Management Techniques
Effective risk management is paramount when employing moving averages in forex trading. Never risk more capital than you can afford to lose on any single trade. Using stop-loss orders is crucial to limit potential losses if a trade moves against you. Stop-loss orders automatically close a position when the price reaches a predetermined level, preventing further losses. Furthermore, diversifying your trading strategies and not relying solely on moving averages is vital. Combining moving averages with other technical indicators, such as RSI or MACD, can provide more robust trading signals and reduce the likelihood of false signals. Position sizing, determining the appropriate amount of capital to allocate to each trade, is also critical in managing risk. A well-defined risk management plan should always be in place before initiating any trade. For instance, a trader might only risk 1-2% of their total trading capital on any single trade, regardless of the expected potential profit.
Visual Representation of Moving Averages on Charts

Moving averages, when plotted on a price chart, provide a visual representation of the average price over a specific period. This smoothed line helps traders identify trends, potential support and resistance levels, and potential buy or sell signals. The visual interpretation of these lines is crucial for making informed trading decisions.
Understanding how moving averages appear visually is key to successfully using them in forex trading. Different moving averages, with varying periods, will create lines with different characteristics, reflecting the underlying price data’s volatility and trend strength. Longer-period moving averages will be smoother and less responsive to short-term price fluctuations, while shorter-period moving averages will be more volatile and closely follow price changes.
Chart Example with Multiple Moving Averages
Imagine a chart displaying the EUR/USD exchange rate over the past three months. Superimposed on the candlestick chart are three moving averages: a 10-period simple moving average (SMA), a 20-period SMA, and a 50-period SMA. The 10-period SMA, being the shortest, is the most responsive to recent price changes and appears as a relatively jagged line, closely hugging the price action. The 20-period SMA is smoother than the 10-period SMA, lagging slightly behind the shorter average and exhibiting less sensitivity to daily price swings. Finally, the 50-period SMA is the smoothest of the three, representing the long-term average price and showing a significant lag behind the price action. In an uptrend, all three moving averages would generally slope upwards, with the 10-period SMA leading, followed by the 20-period, and then the 50-period. The distance between these moving averages would indicate the strength of the trend; a tighter grouping suggests a weaker trend, while a wider spread indicates a stronger, more established trend. Conversely, in a downtrend, all three would slope downwards, with the same order of leading and lagging averages. During periods of sideways or ranging price action, the moving averages would tend to cluster together, indicating a lack of clear directional momentum. A bullish crossover would occur if the shorter-period moving average (e.g., 10-period SMA) crosses above the longer-period moving average (e.g., 20-period SMA), often interpreted as a potential buy signal. A bearish crossover, where the shorter-period moving average crosses below the longer-period moving average, might be interpreted as a potential sell signal. However, it’s crucial to remember that these signals should be considered in conjunction with other technical indicators and market analysis.
Interpreting Visual Information from Moving Averages
The visual relationship between the price and the moving averages provides significant trading insights. When the price is above the moving average, it generally suggests an uptrend, while a price below the moving average usually suggests a downtrend. The distance between the price and the moving average can also be indicative of the strength of the trend. A significant distance suggests a strong trend, while a closer proximity suggests a weaker or potentially reversing trend. The slope of the moving average itself provides additional information; a steep upward slope indicates a strong uptrend, while a steep downward slope indicates a strong downtrend. A flattening slope suggests weakening momentum. Furthermore, the convergence and divergence of multiple moving averages provide additional insights into trend strength and potential turning points. For example, if the shorter-period moving average starts to diverge significantly from the longer-period moving average, it could signal a potential trend reversal. Finally, crossovers between moving averages, as previously mentioned, can generate buy or sell signals, though these should always be validated by other forms of analysis.
Closing Notes
So, there you have it – a crash course in harnessing the power of moving averages in forex trading. Remember, while moving averages are incredibly useful tools, they’re not magic bullets. Successful forex trading requires a holistic approach, combining technical analysis with risk management and a solid understanding of market dynamics. By mastering moving averages and integrating them into your broader trading strategy, you’ll be well on your way to navigating the exciting, and sometimes unpredictable, world of forex. Happy trading!
Frequently Asked Questions
What’s the best moving average period to use?
There’s no one-size-fits-all answer! The ideal period depends on your trading style, timeframe, and market volatility. Experiment with different periods to find what works best for you.
Can I use moving averages alone to make trading decisions?
While moving averages are valuable, relying solely on them is risky. Combine them with other indicators and consider fundamental analysis for a more comprehensive approach.
How do I deal with false signals from moving averages?
False signals are inevitable. Use proper risk management, like stop-loss orders, to limit potential losses. Confirm signals with other indicators before entering a trade.
Are moving averages useful in all market conditions?
Their effectiveness varies. In highly volatile markets, short-term moving averages might generate many false signals. In ranging markets, they might not provide clear directional clues.
Finish your research with information from Forex Scalping: What It Is and How to Profit.


