How to Use Fibonacci Retracement in Forex? Sounds complicated, right? Wrong! This powerful tool, based on the mystical Fibonacci sequence, can actually unlock hidden patterns in the forex market, revealing potential support and resistance levels. Think of it as a secret map to potential profits – if you know how to read it. We’ll break down the seemingly complex into simple, actionable steps, showing you how to identify swing highs and lows, draw those crucial retracement lines, and even combine this technique with other indicators for a seriously boosted trading strategy. Get ready to level up your forex game.
We’ll explore the mathematical magic behind Fibonacci numbers and how they translate to predictable price movements. You’ll learn to spot those key swing highs and lows on your charts, master the art of drawing accurate retracement lines, and interpret the signals they give. We’ll also show you how to integrate Fibonacci retracement with other technical indicators for a more robust trading approach, complete with risk management strategies to keep your hard-earned capital safe. By the end, you’ll be confidently using Fibonacci retracement to identify potential trading opportunities and navigate the forex market like a pro.
Introduction to Fibonacci Retracement
Fibonacci retracement is a powerful tool used by forex traders to identify potential support and resistance levels. It’s based on the Fibonacci sequence, a series of numbers where each number is the sum of the two preceding ones (e.g., 0, 1, 1, 2, 3, 5, 8, 13, and so on). While seemingly simple, this sequence reveals fascinating mathematical ratios that surprisingly appear in various natural phenomena and, as we’ll see, in financial markets.
The mathematical basis lies in the ratios derived from the Fibonacci sequence. Specifically, traders focus on key ratios like 23.6%, 38.2%, 50%, 61.8%, and 78.6%. These percentages represent approximate ratios between consecutive Fibonacci numbers (e.g., 23.6% is roughly 2/8, 38.2% is approximately 3/8, and 61.8% is close to 5/8). These ratios are believed to represent key points where price reversals or corrections might occur during a trend.
Fibonacci Retracement Levels
These key Fibonacci retracement levels are used to predict potential price reversal points. The 23.6%, 38.2%, and 61.8% levels are considered the most significant, with the 50% level often acting as a strong support or resistance point, and 78.6% representing a more significant reversal potential. Imagine a price surge; these levels help predict where the price might pause before continuing its trend. For example, if a currency pair is experiencing an upward trend, the 23.6%, 38.2%, and 61.8% retracement levels from the previous swing high to swing low might act as support zones. Conversely, during a downward trend, these levels might function as resistance zones.
Identifying Swing Highs and Lows
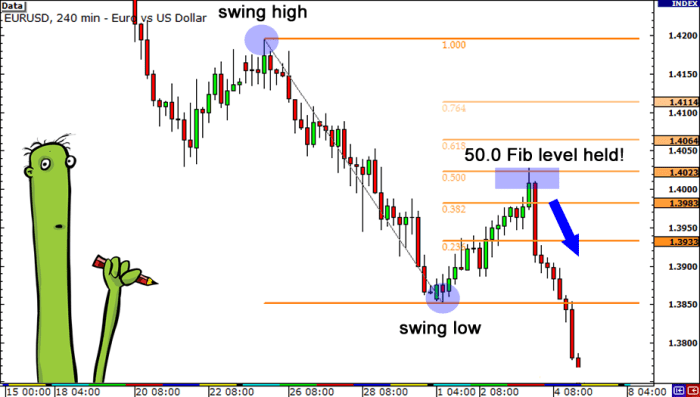
Accurately identifying swing highs and lows is crucial for applying Fibonacci retracement effectively. A swing high is the highest point in a price trend before a significant reversal. Conversely, a swing low is the lowest point before a significant price increase. To identify these, you need to look for price peaks and troughs that clearly mark the boundaries of a trend. These aren’t necessarily the absolute highest or lowest points of the entire chart but rather significant turning points within a defined period.
Consider a simple example: Imagine a chart showing a steady upward trend followed by a temporary dip. The highest point before the dip represents a swing high. The lowest point of the dip before the price resumes its upward movement marks the swing low. Drawing a trendline connecting these two points forms the basis for applying the Fibonacci retracement tool. Once these points are established, you can use your trading platform’s built-in Fibonacci tool to project the retracement levels onto the chart, enabling you to identify potential support and resistance areas. Remember that these are not guaranteed reversal points, but rather probabilistic zones where price action may exhibit specific behaviors.
Identifying Swing Highs and Lows
Pinpointing swing highs and lows is crucial for successfully applying Fibonacci retracements in forex trading. These points represent significant shifts in price momentum, acting as anchors for your retracement levels. Identifying them accurately is the key to unlocking the predictive power of Fibonacci analysis. Without precise identification, your retracement levels will be inaccurate, leading to potentially flawed trading decisions.
Swing highs and lows are visually identified on a price chart as points where the price reverses direction after a notable upward or downward movement. A swing high is the highest point in a price swing, followed by a lower low, while a swing low is the lowest point, followed by a higher high. The challenge lies in determining which highs and lows are significant enough to be used as reliable reference points for Fibonacci analysis.
Swing High and Low Identification on Different Timeframes
The timeframe you choose significantly impacts the identification of swing highs and lows. Using a shorter timeframe, like a 15-minute chart, will reveal many more swing points, potentially leading to “noise” and less significant retracements. Conversely, a longer timeframe, such as a daily or weekly chart, will show fewer, but potentially more substantial swing points, indicating larger and more reliable price movements. Traders often use multiple timeframes to confirm their analysis. For example, a trader might identify potential swing points on a daily chart and then use a 4-hour chart to fine-tune the precise location of those points. This multi-timeframe approach helps to filter out less significant price fluctuations and focus on the more pronounced trends. A daily chart might show a clear swing high, but the 4-hour chart can reveal whether that high was a true reversal or just a temporary pause within a larger uptrend.
Methods for Identifying Swing Points
Several methods exist for identifying swing points, each with its own strengths and weaknesses. The subjective nature of visual identification introduces a degree of uncertainty, but combining methods can improve accuracy.
Visual Inspection
This is the most common method, relying on the trader’s experience and judgment to visually identify points of significant price reversal. Strengths include simplicity and direct observation of price action. However, weaknesses include subjectivity and potential for bias, particularly in volatile markets. A trader might inadvertently choose a swing high that’s only slightly higher than adjacent peaks, leading to inaccurate Fibonacci levels.
Using Indicators
Technical indicators, such as moving averages or Relative Strength Index (RSI), can assist in identifying potential swing points. Moving averages can highlight changes in momentum, while RSI can signal overbought or oversold conditions, suggesting potential reversals. Strengths include objectivity and the ability to quantify momentum changes. However, weaknesses include the potential for lagging indicators and false signals. A moving average crossover might signal a swing low, but the price could continue to fall before ultimately reversing.
Combination of Methods
The most robust approach often involves combining visual inspection with technical indicators. A trader might visually identify potential swing points and then use indicators to confirm their significance and timing. This combined approach leverages the strengths of each method while mitigating their weaknesses. For example, a trader might visually identify a swing high and then check if the RSI is in overbought territory, confirming the potential for a price reversal.
Drawing Fibonacci Retracement Levels
Successfully identifying swing highs and lows is only half the battle. The next crucial step in utilizing Fibonacci retracement is accurately drawing the retracement levels on your Forex chart. This process, while seemingly simple, requires precision to ensure reliable interpretations of price action. Inaccurate placement can lead to flawed trading decisions.
Drawing Fibonacci retracement lines involves using the tools built into most Forex trading platforms. These tools typically allow you to select two points on your chart – a swing high and a swing low (or vice versa) – and automatically calculate and display the Fibonacci retracement levels (23.6%, 38.2%, 50%, 61.8%, and 100%). The placement of these points directly impacts the accuracy of the levels.
Drawing Fibonacci Retracement Lines from Swing High to Swing Low
This is the most common method. You start by identifying a clear swing high, representing a peak in price, and then locate a subsequent clear swing low, representing a trough in price. Once identified, use your platform’s Fibonacci retracement tool to select the swing high as your first point and the swing low as your second point. The tool will then automatically plot the retracement levels between these two points. Imagine a chart showing the EUR/USD pair. A swing high is identified at 1.1200, and after a decline, a swing low is formed at 1.1000. Drawing a Fibonacci retracement tool from the high to the low will project levels at 1.1076 (23.6%), 1.1124 (38.2%), 1.1100 (50%), 1.1048 (61.8%), and 1.1000 (100%). These levels then act as potential support or bounce points.
Drawing Fibonacci Retracement Lines from Swing Low to Swing High
Conversely, you can draw the lines from a swing low to a subsequent swing high. This approach is particularly useful when analyzing an upward trend. In this case, you select the swing low as your first point and the swing high as your second. The resulting retracement levels will again represent potential resistance or reversal points. Consider the GBP/USD pair. A swing low occurs at 1.2500, and the price rallies to a swing high of 1.2700. Drawing the Fibonacci tool from low to high would project levels at 1.2558 (23.6%), 1.2612 (38.2%), 1.2600 (50%), 1.2642 (61.8%), and 1.2700 (100%).
Best Practices for Accurate Placement
Accurate placement of the swing highs and lows is paramount. Avoid using minor fluctuations or “noise” in the price action. Focus on significant price swings that clearly represent a change in momentum. Consider the context of the broader trend. Are you in an uptrend or a downtrend? This will help you identify the most relevant swing points. Finally, remember that Fibonacci retracement is just one tool among many. It’s most effective when used in conjunction with other technical indicators and forms of analysis to confirm potential trading signals. Using only Fibonacci retracement for trading decisions might lead to unreliable results.
Interpreting Fibonacci Retracement Levels
Fibonacci retracement levels aren’t magical predictors of future price movements, but they offer valuable insights into potential support and resistance areas. Understanding how price reacts at these levels is crucial for identifying potential trading opportunities. Essentially, these levels represent areas where the price is statistically more likely to pause, reverse, or consolidate before continuing its trend.
By observing price behavior around these key levels, traders can gauge the strength of the current trend and make informed decisions about entering or exiting trades. A strong trend will often see a swift bounce off a retracement level, while a weakening trend might break through a level more easily. Let’s delve into interpreting these levels and recognizing potential trading setups.
Support and Resistance at Fibonacci Levels
Fibonacci retracement levels, typically 23.6%, 38.2%, 50%, 61.8%, and 78.6%, act as potential support levels during an uptrend and resistance levels during a downtrend. When the price reaches a retracement level, it may encounter buying pressure (support) in an uptrend, preventing further declines, or selling pressure (resistance) in a downtrend, preventing further advances. The strength of the support or resistance depends on various factors, including the overall market sentiment, volume, and the presence of other technical indicators. For instance, a strong bounce off the 61.8% retracement level might suggest a continuation of the uptrend, while a break below this level could signal a potential trend reversal. Conversely, in a downtrend, a strong rejection at the 38.2% level could indicate a temporary pause before the downtrend resumes.
Price Reactions at Fibonacci Levels
The price reaction at Fibonacci levels provides crucial information about the market’s sentiment and the strength of the underlying trend. A strong bounce off a retracement level, accompanied by increased volume, suggests strong support or resistance. This confirms the validity of the level and potentially indicates a continuation of the prevailing trend. Conversely, a weak reaction or a break through a retracement level may indicate a weakening trend or a potential trend reversal. A break through a key Fibonacci level, such as the 61.8% retracement, often triggers stop-loss orders and can lead to a significant price movement in the opposite direction.
Consider a scenario where the price of a currency pair is trending upwards. It then retraces to the 38.2% Fibonacci level. If the price bounces strongly off this level, with increased trading volume, it suggests that buyers are stepping in to support the uptrend. This could be interpreted as a buying opportunity. However, if the price breaks through the 38.2% level with significant volume, it suggests the uptrend is weakening, and a bearish reversal may be underway. This scenario could signal a potential short selling opportunity.
Identifying Trading Opportunities
Fibonacci retracements provide a framework for identifying potential trading opportunities, but they should be used in conjunction with other technical indicators and risk management strategies. For example, combining Fibonacci retracements with candlestick patterns or moving averages can enhance the accuracy of trading signals. A bullish engulfing candlestick pattern forming at the 38.2% retracement level in an uptrend, coupled with increased trading volume, would strengthen the bullish signal.
It’s crucial to remember that Fibonacci retracements are not foolproof. Price may not always react precisely at these levels. Therefore, it is essential to use stop-loss orders to limit potential losses and to carefully manage your risk. Always consider the broader market context and other technical indicators before making any trading decisions based on Fibonacci retracements alone. For example, a significant geopolitical event or economic news release might override the signals provided by Fibonacci retracements.
Combining Fibonacci Retracement with Other Indicators: How To Use Fibonacci Retracement In Forex
Fibonacci retracement, while powerful, benefits significantly from integration with other technical indicators. Using it in isolation can lead to missed opportunities or false signals. Combining it with other tools provides confirmation and enhances the accuracy of your trading decisions. This allows for a more robust and reliable trading strategy.
Different indicators offer complementary insights into price action and momentum. For example, moving averages highlight trend direction, while RSI gauges market sentiment. Combining these with Fibonacci retracement allows traders to identify potential reversal points with greater confidence and precision. This approach helps filter out noise and improve risk management.
Fibonacci Retracement and Moving Averages
Moving averages smooth out price fluctuations, revealing underlying trends. Combining them with Fibonacci retracement allows traders to identify potential support and resistance levels within the established trend. For instance, a bullish trend might show a retracement to a 38.2% Fibonacci level, which coincides with a 20-period moving average. This confluence of indicators strengthens the signal for a potential long entry. Conversely, a bearish trend retracing to a 61.8% level near a 50-period moving average could indicate a potential short entry. The intersection of these levels provides a higher probability setup.
A Trading Strategy Integrating Fibonacci Retracement and RSI
This strategy uses Fibonacci retracement to identify potential reversal points within a trend, and the Relative Strength Index (RSI) to confirm the strength of the reversal. The strategy involves:
1. Identifying a clear trend (uptrend or downtrend) using price action or moving averages.
2. Drawing Fibonacci retracement levels on a chart after identifying a swing high (downtrend) or swing low (uptrend).
Obtain direct knowledge about the efficiency of The Benefits of Forex Trading Signals through case studies.
3. Monitoring the RSI. Overbought conditions (RSI above 70) suggest potential bearish reversals in an uptrend, while oversold conditions (RSI below 30) suggest potential bullish reversals in a downtrend.
4. Entering a trade when a Fibonacci retracement level coincides with an RSI signal confirming a potential reversal. For example, a retracement to the 38.2% level with an RSI reading below 30 in a downtrend would be a strong buy signal.
5. Setting a stop-loss order below the swing low (for long positions) or above the swing high (for short positions) to manage risk.
Check How to Use Elliott Wave Theory in Forex Trading to inspect complete evaluations and testimonials from users.
6. Setting a take-profit target based on the potential price movement to the next Fibonacci extension level or a predetermined risk-reward ratio.
Example: EUR/USD Trading Scenario
Let’s imagine the EUR/USD pair is in a clear downtrend. A swing high is identified at 1.1200, followed by a swing low at 1.1000. Fibonacci retracement levels are drawn. The 38.2% retracement level sits at 1.1122. The RSI is currently at 28, indicating oversold conditions.
| Indicator | Signal | Action | Result |
|---|---|---|---|
| Fibonacci Retracement | Price reaches 38.2% retracement level (1.1122) | Buy EUR/USD | Price rebounds from 1.1122, reaching the 1.1180 take-profit target. |
| RSI | RSI at 28 (oversold) | Confirms buy signal | Supports the entry decision. |
Risk Management and Position Sizing
Fibonacci retracement is a powerful tool, but relying solely on it for Forex trading decisions is a recipe for disaster. Consistent profitability requires a robust risk management strategy alongside your technical analysis. Understanding and implementing effective risk management is crucial to protect your capital and ensure long-term success in the volatile Forex market. Ignoring this aspect can quickly lead to significant losses, eroding your trading account and potentially ending your trading journey prematurely.
Risk management, in the context of Fibonacci retracement trading, involves carefully controlling the amount of capital you risk on any single trade. This is done to prevent substantial losses even if your analysis based on Fibonacci levels is inaccurate. It’s about acknowledging that market movements are unpredictable, and even the best trading strategies can fail. Therefore, the key is to limit potential losses and preserve your trading capital for future opportunities.
Risk Management Techniques
Effective risk management strategies aren’t about avoiding losses entirely—that’s impossible in trading. Instead, they focus on limiting the size of losses and preserving capital for future opportunities. A key aspect is to determine your acceptable risk tolerance, which varies significantly between traders. This tolerance level guides your position sizing decisions and overall trading strategy.
- Stop-Loss Orders: A stop-loss order automatically closes a trade when the price reaches a predetermined level, limiting potential losses. For example, if you enter a long position and set a stop-loss order at the next significant Fibonacci support level, your loss will be capped even if the market moves against you unexpectedly.
- Take-Profit Orders: These orders automatically close a trade when the price reaches a specified level, securing profits. Combining stop-loss and take-profit orders helps define your risk-reward ratio. A common strategy is to set a take-profit target at a Fibonacci resistance level that’s a multiple of the distance to your stop-loss.
- Trailing Stop-Loss Orders: These orders move your stop-loss level as the price moves in your favor, locking in profits while minimizing potential losses if the price reverses. For instance, as the price rises beyond your initial take-profit target, you might trail your stop-loss up to a specific Fibonacci support level to secure a portion of your profits.
- Diversification: Don’t put all your eggs in one basket. Diversifying your trades across different currency pairs reduces the impact of a single losing trade on your overall portfolio. This means not focusing solely on one currency pair or relying on Fibonacci retracement as your only trading strategy.
Position Sizing Strategies
Position sizing determines the amount of capital allocated to each trade. It’s intrinsically linked to risk management, as it directly influences the potential impact of both winning and losing trades. The goal is to find a balance that maximizes potential profits while minimizing risk of substantial losses. The amount you risk on each trade should be a small percentage of your overall trading capital, commonly ranging from 1% to 5%, depending on your risk tolerance.
- Fixed Fractional Position Sizing: This involves risking a fixed percentage of your account balance on each trade, regardless of the expected profit or loss. For example, risking 2% of your $10,000 account means risking $200 per trade. This approach ensures consistency in risk management.
- Fixed Ratio Position Sizing: This method involves maintaining a consistent risk-reward ratio across trades. For example, if your risk-reward ratio is 1:2, you might risk $100 to potentially profit $200. This approach aims to ensure that your winning trades outweigh your losses.
- Volatility-Based Position Sizing: This strategy adjusts your position size based on the volatility of the currency pair. In highly volatile markets, you might reduce your position size to limit potential losses. Conversely, in less volatile markets, you might increase your position size to capitalize on potential profits. This approach adapts to market conditions.
Common Mistakes to Avoid
Fibonacci retracement, while a powerful tool, can lead to inaccurate trading decisions if used improperly. Understanding common pitfalls and how to avoid them is crucial for improving trading accuracy and minimizing losses. Ignoring these mistakes can turn a potentially profitable strategy into a losing one.
Over-reliance on Fibonacci levels alone is a significant mistake. Many traders treat these levels as absolute points of support and resistance, entering trades solely based on their intersection with price. This neglects other crucial factors like market context, volume, and other technical indicators. Successful trading requires a holistic approach.
Ignoring Market Context
Relying solely on Fibonacci retracement without considering the broader market context is a recipe for disaster. A retracement level might be hit, but if the overall trend is strongly bearish, the bounce might be short-lived. Conversely, a bullish trend might easily break through a perceived Fibonacci support level. Successful traders analyze charts holistically, considering factors like overall market sentiment, news events, and the strength of the current trend. For instance, during a period of high volatility driven by geopolitical events, Fibonacci levels might be less reliable as price action becomes more unpredictable.
Misidentification of Swing Highs and Lows
The accuracy of Fibonacci retracement hinges entirely on the correct identification of swing highs and lows. Subjectivity in identifying these points can lead to inaccurate retracement levels. Inconsistent or poorly defined swing points will render the Fibonacci tool practically useless. Experienced traders often use multiple chart timeframes to confirm swing points and ensure accuracy. A mistake in identifying a swing low, for example, could lead to a false signal and potentially result in an unprofitable trade.
Expecting Perfect Precision
Fibonacci retracement levels are not magical guarantees. Price action rarely aligns perfectly with these levels. Traders should anticipate some degree of deviation and not expect pinpoint accuracy. Instead of focusing on exact numbers, consider the levels as zones of potential support or resistance. Look for price reactions within a range around the calculated Fibonacci levels, rather than precisely at them. For example, a 38.2% retracement level might not be hit exactly, but a reaction within a 37-39% range could still be considered a valid signal.
Failure to Combine with Other Indicators
Using Fibonacci retracement in isolation can be limiting. Combining it with other technical indicators, such as moving averages, RSI, or MACD, can provide more robust confirmation signals. This multi-indicator approach helps filter out false signals and increases the probability of successful trades. For instance, a bullish divergence on the RSI, coupled with a price bounce at the 61.8% Fibonacci retracement level, offers a stronger buy signal than either indicator alone.
Ignoring Risk Management
Regardless of how accurate your Fibonacci analysis is, effective risk management is paramount. Always use stop-loss orders to limit potential losses and never risk more than a small percentage of your trading capital on any single trade. Ignoring risk management, even with precise Fibonacci signals, can lead to substantial losses and wipe out trading accounts quickly. For example, a well-defined risk management plan might dictate risking only 1-2% of your capital on any single trade, irrespective of the confidence level in the Fibonacci signal.
Advanced Techniques and Applications
Mastering Fibonacci retracement involves more than just identifying swing highs and lows; it’s about integrating this powerful tool into a comprehensive trading strategy. This section explores advanced applications, combining Fibonacci retracement with other tools and applying it to different trading styles.
Advanced techniques unlock the full potential of Fibonacci retracement, moving beyond basic identification of support and resistance levels. By combining it with other Fibonacci tools and integrating it into various trading styles, traders can refine their entries and exits, potentially improving profitability and risk management.
Combining Fibonacci Retracement with Other Fibonacci Tools
Fibonacci retracement works synergistically with other Fibonacci tools, providing a more comprehensive view of market dynamics. For instance, combining retracement levels with Fibonacci extensions can help predict potential price targets after a significant move. Fibonacci fans, on the other hand, offer dynamic support and resistance levels that adjust as the price fluctuates. Using these tools together can help confirm potential trade setups and refine profit targets. For example, a retracement to the 61.8% level, coupled with a confluence of a Fibonacci fan line and an extension target, could suggest a high-probability long entry.
Fibonacci Retracement in Different Forex Trading Strategies, How to Use Fibonacci Retracement in Forex
The versatility of Fibonacci retracement allows its application across diverse trading styles. In scalping, traders might use retracements to identify short-term reversals within a trending market, aiming for quick profits. Swing traders, conversely, might employ retracements to identify potential entry points for longer-term positions, targeting larger price swings. The key is adapting the timeframe and strategy to the specific trading style. A scalper might focus on the 23.6% and 38.2% retracement levels, while a swing trader might prioritize the 50% and 61.8% levels.
Example of a Successful Trade Using Fibonacci Retracement
Imagine a EUR/USD chart showing a clear uptrend. A swing high is established, followed by a pullback. Using Fibonacci retracement, we identify the 38.2% retracement level as a potential support zone. Price action shows a clear bounce off this level, with increased buying volume confirming the support. A subsequent break above the previous swing high confirms the continuation of the uptrend. We enter a long position at the 38.2% retracement level, placing a stop-loss below the recent swing low. The price subsequently continues its upward trajectory, reaching the previously identified Fibonacci extension target at 127.2% of the initial swing. We exit the trade at this target, locking in a significant profit. This scenario demonstrates how confluence of price action and Fibonacci levels can lead to a successful trade.
Concluding Remarks
Mastering Fibonacci retracement isn’t just about learning the mechanics; it’s about understanding the underlying market psychology. By combining this powerful tool with disciplined risk management and a strategic approach, you can significantly enhance your forex trading performance. Remember, consistent practice and a keen eye for chart patterns are key. While Fibonacci retracement can be incredibly helpful, it’s not a magic bullet. It’s one piece of the puzzle, and using it effectively alongside other indicators and a solid trading plan is crucial for long-term success in the dynamic world of forex trading. So, start charting, start analyzing, and start making smarter trades.
FAQ Insights
What are the limitations of Fibonacci Retracement?
Fibonacci retracement isn’t a foolproof predictor. Market conditions can override its signals, and false breakouts are possible. It’s best used as one tool among many in a comprehensive trading strategy.
How accurate are Fibonacci retracement levels?
Accuracy varies. While often providing valuable insights, price action doesn’t always adhere precisely to these levels. They’re more about identifying potential support and resistance zones, not guaranteed price points.
Can I use Fibonacci retracement for all currency pairs?
Yes, but its effectiveness can vary depending on the pair’s volatility and market trends. Some pairs might show stronger adherence to Fibonacci levels than others.
What timeframe is best for Fibonacci retracement?
The ideal timeframe depends on your trading style. Swing traders might use daily or weekly charts, while scalpers might prefer shorter timeframes.


