How to Use Support and Resistance Levels in Forex? Think of it like this: the forex market is a rollercoaster, but with support and resistance levels, you’ve got a map to navigate the dips and climbs. Mastering these levels isn’t just about predicting the future; it’s about understanding market psychology and using that knowledge to your advantage. This guide will show you how to identify these crucial levels, use them in your trading strategies, and even anticipate when they might fail. Get ready to level up your forex game.
We’ll dive deep into identifying support and resistance visually on charts, using technical indicators like Fibonacci retracements and candlestick patterns to confirm them. You’ll learn various trading strategies, from breakouts to pullbacks, and how to set stop-loss and take-profit orders effectively. We’ll also cover advanced techniques, including dynamic support and resistance, and how news events can impact these key levels. Prepare for a journey into the heart of forex trading!
Understanding Support and Resistance
Support and resistance levels are fundamental concepts in Forex trading, acting as invisible magnets influencing price movements. They represent price zones where buying or selling pressure is particularly strong, leading to temporary price reversals or consolidations. Understanding these levels is crucial for identifying potential entry and exit points, managing risk, and ultimately, improving trading performance.
Essentially, support is a price level where the buyers are strong enough to prevent the price from falling further. Conversely, resistance is a price level where sellers dominate, preventing the price from rising beyond a certain point. These levels are not static; they are dynamic and can shift based on market conditions and trading activity.
Learn about more about the process of Forex Trading Psychology: How to Stay Calm Under Pressure in the field.
Visual Identification of Support and Resistance
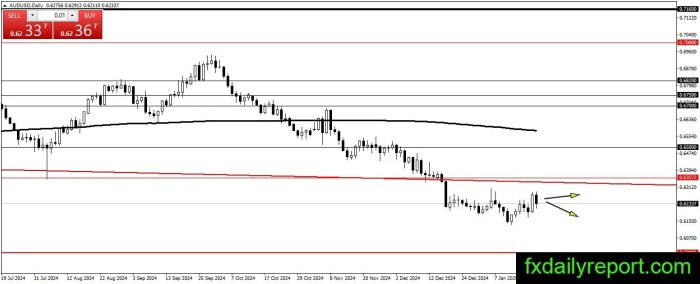
Support and resistance levels are typically identified on price charts by observing previous price action. Support is often seen as a low point where the price bounced back upwards, while resistance is a high point where the price reversed downwards. Imagine a price chart showing a series of higher highs and higher lows (an uptrend). A previous high, where the price failed to break through and instead reversed, would represent a resistance level. Conversely, in a downtrend (lower highs and lower lows), a previous low where the price bounced back would represent support. Multiple instances of price reversal at similar price points reinforce the significance of those levels. For instance, if the price bounces off 1.1000 three times, it strengthens the idea that 1.1000 is a significant support level.
Psychological Factors Influencing Support and Resistance
The formation of support and resistance levels is not just a matter of pure price action; psychology plays a significant role. At support levels, traders who bought at lower prices are more likely to hold onto their positions, preventing further price drops. Similarly, at resistance levels, traders who bought at higher prices might take profits, preventing further price increases. This collective behavior creates a self-fulfilling prophecy: the expectation of support or resistance can itself influence price movement. Furthermore, round numbers (like 1.1000 or 1.2000) often act as psychological barriers, as traders tend to focus on these easily identifiable levels.
Types of Support and Resistance
Various types of support and resistance levels exist, each with its own characteristics and implications for trading strategies. The table below Artikels some key distinctions.
Notice The Impact of Geopolitics on Forex Trading for recommendations and other broad suggestions.
| Type | Description | Identification | Strength |
|---|---|---|---|
| Horizontal Support/Resistance | Defined by a horizontal line drawn across previous price highs or lows. | Multiple touches at the same price level. | Generally strong, especially with multiple touches. |
| Trendline Support/Resistance | Created by connecting a series of higher lows (support) or higher highs (resistance) in an uptrend, or lower highs (resistance) and lower lows (support) in a downtrend. | Connecting significant swing lows or highs with a line. | Strength increases with the number of touches and the slope of the trendline. |
| Pivot Points | Calculated using previous day’s high, low, and close prices. | Using a formula (e.g., (High + Low + Close)/3 for the central pivot point). | Can be strong support/resistance levels, but their effectiveness varies. |
| Fibonacci Retracements | Based on the Fibonacci sequence, identifying potential support and resistance levels based on percentage retracements of a price move. | Applying Fibonacci ratios (e.g., 23.6%, 38.2%, 50%, 61.8%, 78.6%) to a significant price swing. | Strength depends on the context and market conditions. |
Identifying Support and Resistance Levels

Spotting support and resistance levels is like finding the hidden anchors in the forex market’s wild ocean. These levels represent price points where buying or selling pressure is particularly strong, often causing price reversals or consolidations. Mastering their identification is crucial for effective trading strategies. Let’s dive into the practical methods.
Identifying Support and Resistance Using Technical Indicators
Technical indicators can significantly enhance your ability to pinpoint potential support and resistance areas. While they don’t guarantee future price movements, they offer valuable insights into market sentiment and momentum. For example, the Relative Strength Index (RSI) can highlight overbought (resistance) and oversold (support) conditions. When the RSI approaches the overbought level (typically 70), it suggests potential resistance, indicating a possible price reversal. Conversely, an RSI near the oversold level (typically 30) may signal potential support, hinting at a price bounce. Moving averages, like the 20-day and 50-day moving averages, often act as dynamic support and resistance levels. Prices tend to bounce off these averages, especially during trending markets. The MACD (Moving Average Convergence Divergence) can also help; a bullish divergence (price making lower lows while the MACD makes higher lows) suggests potential support, while a bearish divergence (price making higher highs while the MACD makes lower highs) may signal resistance.
Using Candlestick Patterns to Confirm Support and Resistance, How to Use Support and Resistance Levels in Forex
Candlestick patterns provide visual clues about market sentiment and can confirm potential support and resistance levels identified through other methods. For instance, a bullish engulfing pattern at a previous low might confirm that level as strong support. This pattern involves a bearish candlestick followed by a bullish candlestick that completely engulfs the previous one, suggesting a shift in buyer sentiment. Similarly, a bearish engulfing pattern at a previous high might confirm that level as strong resistance. Other patterns, such as hammers (at support) and hanging men (at resistance), offer further confirmation signals. The reliability of these confirmations increases when multiple candlestick patterns appear near the same price level.
Using Fibonacci Retracements to Identify Potential Support and Resistance
Fibonacci retracements are a tool based on the Fibonacci sequence, a mathematical sequence found in nature and often observed in financial markets. These retracements project potential support and resistance levels based on previous price swings. Drawing a Fibonacci retracement tool between a significant swing high and swing low will create a series of horizontal lines representing potential retracement levels (23.6%, 38.2%, 50%, 61.8%, 78.6%, and 100%). These levels often act as areas of support and resistance, where price may pause or reverse. For example, a price decline might find support around the 38.2% retracement level before continuing its downward trend, or a price increase may encounter resistance at the 61.8% retracement level before pulling back.
Drawing Support and Resistance Lines on a Price Chart: A Step-by-Step Guide
1. Identify Swing Highs and Lows: Locate significant price peaks (swing highs) and troughs (swing lows) on the price chart. These represent points where the price experienced a notable reversal.
2. Draw Horizontal Lines: Draw horizontal lines across the chart at these swing highs and lows. These lines represent potential resistance (swing highs) and support (swing lows) levels.
3. Connect Multiple Swing Points: Sometimes, several swing highs or lows will align near the same price level, creating a stronger support or resistance zone. Connecting these points visually strengthens the identified level.
4. Consider the Context: Remember that support and resistance are not absolute barriers. Strong market forces can break through these levels. Consider factors such as market sentiment, news events, and volume when assessing the strength of a support or resistance level. A breakout above a resistance level, confirmed by strong volume, typically suggests a stronger bullish trend.
5. Test and Refine: Continuously monitor the price action. As the market moves, new swing highs and lows will emerge, requiring adjustments to your support and resistance lines. The process is iterative and requires continuous observation and adaptation.
Using Support and Resistance in Trading Strategies: How To Use Support And Resistance Levels In Forex
Support and resistance levels aren’t just pretty lines on a chart; they’re dynamic indicators reflecting market sentiment and potential price turning points. Understanding how to incorporate them into your trading strategy is crucial for improving your win rate and managing risk effectively. This section will explore various strategies, comparing their effectiveness and highlighting common pitfalls.
Breakout and Pullback Strategies
Breakout and pullback strategies represent two fundamentally different approaches to trading support and resistance. A breakout strategy involves entering a trade *after* the price decisively breaks through a support or resistance level, anticipating a continuation of the trend in that direction. Conversely, a pullback strategy involves entering a trade *before* the price breaks through a support or resistance level, betting on a reversal of the current trend.
Breakout strategies often involve placing a stop-loss order just below the broken support level (for long positions) or above the broken resistance level (for short positions). Take-profit orders are typically placed based on technical analysis, risk tolerance, or potential target levels derived from chart patterns or other indicators. Pullback strategies, on the other hand, might utilize stop-loss orders placed just beyond the support or resistance level being tested. Take-profit orders would be placed at a pre-determined level, potentially based on the size of the anticipated pullback.
For example, imagine a currency pair consistently bouncing off a support level at 1.1000. A breakout strategy would involve waiting for a decisive break above 1.1000, then entering a long position with a stop-loss at 1.0990 and a take-profit at 1.1050 (or a more calculated target based on Fibonacci retracements or other technical indicators). A pullback strategy might involve buying near 1.1000 after a slight dip from 1.1020, expecting a return to the previous high. The stop-loss here might be placed below 1.0980, and the take-profit at 1.1020 or higher.
Effectiveness of Strategies Based on Market Conditions
The effectiveness of breakout and pullback strategies is highly dependent on market conditions. In volatile markets characterized by strong trends, breakout strategies often perform better as prices tend to break through support and resistance levels with more force. Conversely, in ranging markets with less pronounced trends, pullback strategies might be more successful, as prices tend to consolidate around support and resistance levels before reversing direction.
Consider a scenario with high market volatility during a major news event. A breakout strategy might be more appropriate, aiming to capitalize on rapid price movements. However, in a period of low volatility, where the price is moving sideways within a defined range, a pullback strategy could be more suitable, profiting from price reversals within that range. It’s crucial to adapt your trading strategy based on prevailing market conditions and avoid forcing a particular strategy when it’s not suitable.
Setting Stop-Loss and Take-Profit Orders
Properly setting stop-loss and take-profit orders is crucial for risk management when using support and resistance levels. Stop-loss orders should be placed just outside the relevant support or resistance level, allowing for some price fluctuation without triggering the order prematurely. The distance from the support/resistance level depends on volatility and risk tolerance.
Take-profit orders should be based on a combination of technical analysis and risk-reward ratios. For example, a trader might aim for a take-profit level that provides a risk-reward ratio of 1:2 or 1:3, meaning that the potential profit is two or three times the potential loss. The exact placement of take-profit orders can be determined by various technical indicators, chart patterns, or simply based on previous price action. For instance, a trader might place a take-profit at a previous swing high or low, or at a Fibonacci retracement level.
Common Mistakes and How to Avoid Them
Many traders fall into common traps when using support and resistance levels. One frequent mistake is failing to account for market context and volatility. Simply relying on historical support and resistance without considering current market dynamics can lead to losses. Another common error is placing stop-loss orders too tightly, leading to frequent whipsaws and premature exits from profitable trades.
Furthermore, some traders mistake a temporary break of support or resistance as a definitive signal, triggering trades based on false breakouts. This can lead to significant losses if the price quickly reverses. Finally, neglecting to adjust stop-loss and take-profit orders based on changing market conditions can also negatively impact trading performance. To avoid these pitfalls, thorough analysis of market conditions, proper risk management techniques, and flexible adaptation of trading strategies are crucial. Using multiple indicators and confirmation signals can also significantly improve the accuracy of your trading decisions.
Advanced Techniques and Considerations
Support and resistance levels, while powerful tools, aren’t foolproof. Understanding their limitations and incorporating advanced techniques significantly improves trading accuracy. This section delves into situations where these levels might fail and explores crucial factors like dynamic levels, volume, price action, and the impact of news.
Situations Where Support and Resistance May Fail
Unexpected market events or shifts in sentiment can easily invalidate established support and resistance levels. A sudden surge in volatility, triggered by unforeseen news, can break through previously impenetrable barriers. For example, the release of unexpectedly strong economic data might cause a rapid price increase, easily surpassing a well-defined resistance level. Similarly, a surprise geopolitical event could send prices plummeting through strong support. These situations highlight the importance of always acknowledging the inherent uncertainty in financial markets and adapting your trading strategies accordingly. Over-reliance on static support and resistance, without considering broader market context, can lead to significant losses.
Dynamic Support and Resistance
Static support and resistance levels are drawn on historical price data. However, dynamic support and resistance are constantly evolving, often tracking moving averages or trendlines. These dynamic levels adjust to the ongoing price movement, providing a more flexible approach to identifying potential support and resistance areas. For instance, a 20-day exponential moving average (EMA) can act as dynamic support; as long as the price remains above this EMA, the upward trend is considered to be intact. A breach below this moving average could signal a potential shift in momentum. Similarly, a trendline connecting higher lows can serve as dynamic support, with a break below suggesting a weakening trend. These dynamic levels offer a more adaptable approach than relying solely on static levels derived from past price highs and lows.
The Importance of Volume and Price Action
Analyzing volume alongside price action provides crucial context when interpreting support and resistance. A strong support level broken with low volume might indicate a temporary weakness, rather than a significant trend reversal. Conversely, a decisive break of resistance with high volume often signals a stronger confirmation of a trend change. For example, imagine a stock price breaking through a resistance level with unusually high trading volume. This suggests strong buying pressure, increasing the likelihood of a sustained price increase beyond the previous resistance, now turned potential support. Ignoring volume data when analyzing support and resistance can lead to misinterpretations and flawed trading decisions. The combination of price and volume provides a more comprehensive picture of market sentiment and the strength of any price movement.
News Events and Economic Data Influence on Support and Resistance
Significant news events and economic data releases can drastically shift support and resistance levels. Unexpected economic reports, geopolitical developments, or policy announcements can cause rapid price fluctuations, rendering previously established levels obsolete. For instance, the surprise announcement of a new central bank interest rate hike could dramatically shift market expectations, leading to a sudden upward movement that easily surpasses existing resistance levels. Conversely, negative news, like a disappointing earnings report, might cause a sharp drop, breaking through support levels. Therefore, staying informed about upcoming economic events and news is crucial for accurate interpretation and adaptation of support and resistance strategies. Ignoring these external factors can lead to significant trading errors.
Practical Application and Examples
Let’s ditch the theory and dive into the real world of forex trading using support and resistance. Understanding how these levels work in practice is crucial for turning knowledge into profitable trades. We’ll explore some scenarios, showing you how to combine support/resistance with other indicators, and visualize successful and unsuccessful trades.
Understanding how support and resistance levels play out in real market conditions is key to successful trading. The following examples illustrate practical applications and demonstrate the importance of careful observation and risk management.
Hypothetical Trading Scenarios
Imagine the EUR/USD pair is trading sideways between 1.1000 and 1.1100 for several days. 1.1000 acts as strong support, repeatedly bouncing the price higher. A trader might place a buy order just above 1.1000, anticipating a price increase towards 1.1100 (resistance). If the price breaks above 1.1100, it signals a potential trend reversal, and the trader might adjust their strategy accordingly, perhaps taking profits or even considering a short position. Conversely, if the price consistently fails to break above 1.1100, repeatedly finding resistance, the trader might adjust their stop-loss order to minimize potential losses. Another scenario could involve a bearish trend where the price consistently finds resistance at 1.1100 and support at 1.1000. A trader could place a short position near 1.1100, aiming to profit from the price decline towards 1.1000.
Support and Resistance with Other Indicators
Support and resistance levels become even more powerful when combined with other technical indicators. For example, using the Relative Strength Index (RSI) alongside support and resistance can enhance trading decisions. If the price approaches a support level and the RSI is oversold (below 30), it strengthens the probability of a price bounce. Conversely, if the price approaches a resistance level and the RSI is overbought (above 70), it increases the likelihood of a price reversal. Similarly, combining support/resistance with moving averages can help confirm trend direction. A price bounce off support confirmed by a bullish crossover of moving averages signals a strong buy signal.
Visual Representation of Successful and Unsuccessful Trades
Let’s visualize a simplified price chart:
“`
Price 1.1200 Resistance
1.1150
1.1100
1.1050
1.1000 Support
1.0950
Time 1 2 3 4 5 6 7 8 9 10
Successful Trade: Buy at 1.1020 (near support), sell at 1.1100 (resistance).
Unsuccessful Trade: Buy at 1.1120 (above resistance), stop-loss triggered at 1.1080.
“`
In this example, the successful trade capitalized on a price bounce off support. The unsuccessful trade failed to recognize the resistance level and resulted in a loss. The chart highlights the importance of precise entry and exit points based on support and resistance levels.
Resources for Further Learning
This section provides resources for continued learning:
* Investopedia: Investopedia offers comprehensive articles and tutorials on forex trading, including detailed explanations of support and resistance.
* Babypips: Babypips provides beginner-friendly resources and educational materials on various aspects of forex trading, including technical analysis.
* Forex Factory: Forex Factory is a popular forex forum and resource website, offering various tools, analysis, and community discussions related to support and resistance.
* TradingView: TradingView is a charting platform that allows you to analyze various markets and technical indicators, including support and resistance.
Last Recap
So, there you have it – a roadmap to conquering the forex market using support and resistance levels. Remember, consistent practice and understanding market context are key. While these levels offer invaluable insights, they’re not a crystal ball. The forex market is dynamic, and even the strongest support can crumble under unexpected pressure. By combining your knowledge of support and resistance with other technical analysis tools and risk management strategies, you’ll significantly improve your chances of success. Now go out there and trade smarter, not harder!
Query Resolution
What happens if a support level is broken?
A broken support level often signals a potential trend reversal or continuation of a downtrend. Traders might consider adjusting their positions or entering short trades.
How reliable are support and resistance levels?
Their reliability varies. Stronger levels, formed by multiple touches and significant price action, tend to be more reliable. Weaker levels can break easily.
Can I use support and resistance with other indicators?
Absolutely! Combining support/resistance with indicators like moving averages, RSI, or MACD can enhance your trading decisions and filter out false signals.
What are some common mistakes to avoid?
Over-reliance on support/resistance alone, ignoring volume, and failing to adapt to changing market conditions are common pitfalls.


