How to Predict Forex Market Movements? It’s the holy grail for many traders, a quest for consistent profits in the volatile world of currency exchange. Mastering this skill isn’t about mystical predictions; it’s about understanding the intricate dance between economic indicators, geopolitical events, and market psychology. This guide dives deep into the strategies and techniques used by successful forex traders, equipping you with the knowledge to navigate this complex landscape and potentially improve your trading outcomes. We’ll explore fundamental and technical analysis, risk management, and the crucial role of emotional intelligence in your trading journey.
From deciphering economic data like GDP and inflation rates to interpreting candlestick patterns and applying technical indicators, we’ll break down the core concepts in an accessible way. You’ll learn how to identify trends, spot potential trading opportunities, and manage risk effectively. We’ll also discuss the importance of staying informed about global events and understanding market sentiment. By the end, you’ll have a solid framework for approaching forex trading with a more informed and strategic approach.
Fundamental Analysis of Forex Markets
Understanding the fundamental factors driving forex market movements is crucial for successful trading. Fundamental analysis delves into the economic and political landscape, examining how these factors influence currency values. By analyzing these underlying forces, traders can gain a better understanding of potential price movements and make more informed trading decisions.
Economic Indicators and Currency Values
Economic indicators provide valuable insights into a country’s economic health and, consequently, its currency’s strength. Key indicators like Gross Domestic Product (GDP), inflation rates, and interest rates significantly impact currency values. A strong GDP growth, for example, often indicates a healthy economy, leading to increased demand for that country’s currency. Conversely, high inflation erodes purchasing power, typically weakening the currency. Similarly, higher interest rates attract foreign investment, boosting currency value. Let’s explore these relationships further. A nation experiencing robust GDP growth usually sees its currency appreciate as investors flock to participate in the expanding economy. Conversely, a country grappling with high inflation might see its currency depreciate as its purchasing power diminishes. Central banks often manipulate interest rates to influence inflation and currency value. Raising interest rates can attract foreign investment, increasing demand for the currency and strengthening it.
Geopolitical Events and Forex Market Movements
Geopolitical events, from political instability to international conflicts and trade wars, can dramatically impact currency values. Uncertainty and risk aversion often lead to capital flight from affected regions, causing their currencies to depreciate. For instance, a sudden political upheaval in a country could trigger a sharp decline in its currency as investors seek safer havens. Conversely, positive geopolitical developments, such as the resolution of a long-standing conflict or the signing of a significant trade agreement, can lead to currency appreciation. The impact of geopolitical events can be immediate and significant, often outweighing the influence of economic indicators in the short term. Consider the impact of the 2014 Crimean crisis on the Russian Ruble; the event triggered a sharp devaluation as investors reacted to the increased geopolitical risk.
Central Bank Policies and Currency Pairs
Central banks play a pivotal role in influencing their respective currencies. Their monetary policies, particularly interest rate adjustments, directly affect currency values. For example, if a central bank raises interest rates, it typically attracts foreign investment, increasing demand for its currency and causing it to appreciate relative to other currencies. Conversely, lowering interest rates can weaken a currency. The effects of central bank policies can vary across currency pairs, depending on the relative monetary policies of the countries involved. For instance, if the US Federal Reserve raises interest rates while the European Central Bank maintains its rates, the US dollar (USD) is likely to appreciate against the Euro (EUR).
Correlation Between Major Economic Indicators and Currency Fluctuations
The following table illustrates the general correlation between major economic indicators and currency fluctuations. Note that these are general trends and actual market movements can be complex and influenced by numerous other factors.
| Economic Indicator | Impact on Currency Value | Example | Currency Pair Example |
|---|---|---|---|
| GDP Growth (Increase) | Appreciation | Strong economic expansion | USD/JPY (USD appreciates if US GDP grows strongly) |
| Inflation (Increase) | Depreciation | High inflation erodes purchasing power | EUR/GBP (EUR depreciates if Eurozone inflation rises significantly) |
| Interest Rates (Increase) | Appreciation | Attracts foreign investment | GBP/USD (GBP appreciates if the Bank of England raises interest rates) |
| Trade Balance (Surplus) | Appreciation | Indicates strong export demand | AUD/USD (AUD appreciates if Australia has a significant trade surplus) |
Technical Analysis Techniques for Forex Trading

Technical analysis offers a powerful lens through which to view forex market movements, focusing on price action and volume to predict future trends. Unlike fundamental analysis, which considers economic factors, technical analysis relies solely on historical price data and chart patterns. Mastering these techniques can significantly improve your trading strategies, helping you identify profitable entry and exit points. This section delves into key technical analysis tools for forex trading.
Moving Averages for Trend Identification
Moving averages smooth out price fluctuations, making it easier to identify the underlying trend. A simple moving average (SMA) calculates the average price over a specific period, while an exponential moving average (EMA) gives more weight to recent prices. By comparing different moving averages, traders can identify potential buy or sell signals. For instance, a “golden cross” occurs when a short-term moving average (e.g., 50-day EMA) crosses above a long-term moving average (e.g., 200-day EMA), often signaling a bullish trend reversal. Conversely, a “death cross” (short-term moving average crossing below the long-term moving average) might suggest a bearish reversal. Traders often use multiple moving averages simultaneously to confirm trend direction and identify potential entry points. For example, a trader might use a 20-day SMA and a 50-day SMA. When the 20-day SMA crosses above the 50-day SMA, it could be interpreted as a bullish signal, suggesting a potential upward trend.
Candlestick Patterns for Price Direction Prediction
Candlestick patterns, formed by daily or hourly price movements, provide visual representations of market sentiment. These patterns offer insights into potential price reversals or continuations. A “hammer” candlestick, for example, characterized by a small body and a long lower wick, often signals a potential bullish reversal at the bottom of a downtrend. Conversely, a “hanging man,” similar to a hammer but occurring at the top of an uptrend, suggests a possible bearish reversal. Recognizing these patterns requires practice and understanding the context within the broader market trend. For example, a hammer candlestick appearing after a significant downtrend, supported by other bullish indicators, holds more weight than one appearing in a sideways market. The effectiveness of candlestick patterns relies heavily on confirmation from other technical indicators and the overall market context.
Support and Resistance Levels in Forex Trading Strategies
Support and resistance levels represent price zones where the market has historically struggled to break through. Support levels represent price floors where buying pressure is expected to outweigh selling pressure, preventing further price declines. Resistance levels, conversely, represent price ceilings where selling pressure is expected to overcome buying pressure, hindering further price increases. These levels can be identified by observing previous highs and lows on a price chart. A break above a resistance level often signals a bullish breakout, while a break below a support level can signal a bearish breakout. Traders often place stop-loss orders just below support or above resistance to limit potential losses if a breakout fails. For instance, if a currency pair consistently finds support at 1.1000, a trader might anticipate a bounce off this level and position themselves accordingly. A break below this level, however, could signal a significant downtrend.
Flowchart for Identifying Potential Trading Opportunities
The following flowchart illustrates a simplified process for identifying potential trading opportunities using technical indicators:
[Imagine a flowchart here. The flowchart would begin with “Analyze Price Chart.” This would branch into two options: “Identify Trend (using moving averages)” and “Identify Candlestick Patterns.” The “Identify Trend” branch would lead to “Confirm Trend with Indicators.” The “Identify Candlestick Patterns” branch would also lead to “Confirm Pattern with Indicators.” Both branches would converge at “Identify Support/Resistance Levels.” This would lead to “Assess Risk/Reward Ratio.” Finally, this would lead to “Execute Trade (or Wait).” Arrows would connect each step.]
This flowchart Artikels a simplified approach. In reality, forex trading involves a more complex interplay of indicators and risk management strategies.
Understanding Chart Patterns and Indicators
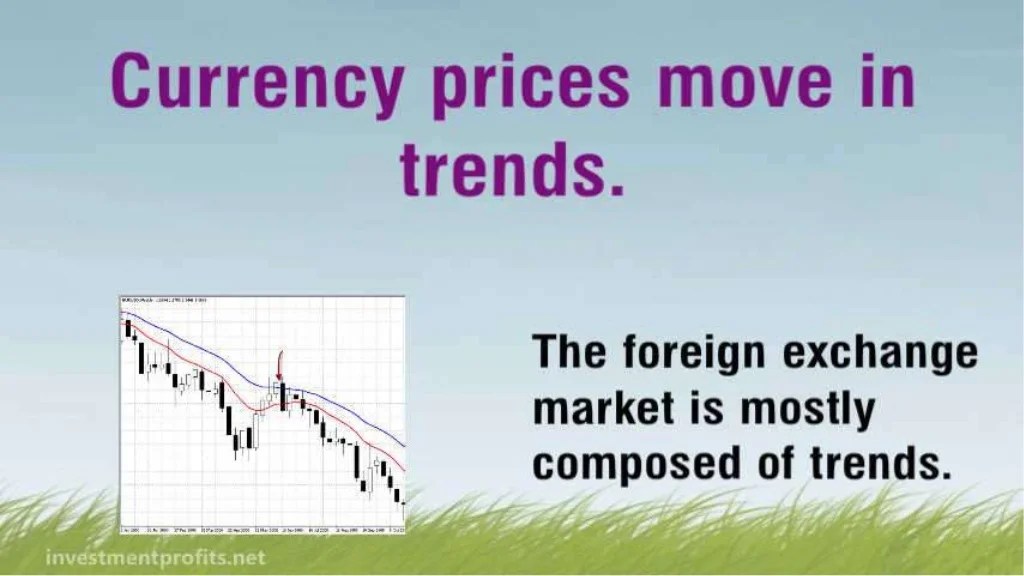
Chart patterns and technical indicators are crucial tools for forex traders seeking to predict market movements. They provide visual representations of price action and momentum, allowing traders to identify potential entry and exit points with increased confidence. While not foolproof, mastering these tools can significantly enhance your trading strategy.
Common Chart Patterns and Their Implications
Chart patterns are recurring formations on price charts that often precede specific price movements. Recognizing these patterns can offer valuable insights into potential future price direction. For instance, a head and shoulders pattern, characterized by three peaks (the left shoulder, head, and right shoulder), often signals a bearish reversal. The neckline, a line connecting the troughs between the peaks, acts as a support level before the price breaks down. Conversely, an inverse head and shoulders pattern, with three troughs, suggests a bullish reversal. Triangles, formed by converging trendlines, indicate periods of consolidation before a potential breakout in either direction. Flags, characterized by a short, rectangular consolidation period within a larger trend, suggest a continuation of the prevailing trend after the breakout. The reliability of these patterns increases with the presence of strong volume confirmation during breakouts.
Key Technical Indicators and Their Characteristics
Technical indicators are mathematical calculations based on price and/or volume data that help traders gauge market momentum, trend strength, and potential reversals. The Relative Strength Index (RSI) measures the magnitude of recent price changes to evaluate overbought or oversold conditions. An RSI above 70 generally suggests an overbought market, prone to a correction, while an RSI below 30 indicates an oversold market, potentially poised for a rebound. The Moving Average Convergence Divergence (MACD) is a trend-following momentum indicator that shows the relationship between two moving averages. A bullish crossover (MACD line crossing above the signal line) suggests a potential uptrend, while a bearish crossover (MACD line crossing below the signal line) signals a potential downtrend. Bollinger Bands display price volatility by plotting standard deviations around a moving average. Prices bouncing off the upper band might suggest an overbought condition, while bouncing off the lower band might signal an oversold condition. The width of the bands also reflects volatility; wider bands indicate increased volatility, while narrower bands suggest lower volatility.
Effectiveness of Technical Indicators in Various Market Conditions
The effectiveness of technical indicators varies depending on market conditions. In trending markets, trend-following indicators like MACD and moving averages are generally more effective. However, in ranging markets, oscillators like RSI and stochastic oscillators can be more helpful in identifying potential reversals. Bollinger Bands can be useful in both trending and ranging markets to gauge volatility and identify potential breakouts or pullbacks. It’s important to note that no indicator is perfect, and combining multiple indicators can improve accuracy. For example, confirming a bullish signal from the MACD with an RSI reading above 30 can increase the confidence level in a potential buy signal.
Categorization of Technical Indicators by Function
Technical indicators can be categorized based on their primary function:
- Trend-Following Indicators: These indicators aim to identify the prevailing trend and its strength. Examples include moving averages (simple, exponential, weighted), MACD, and ADX (Average Directional Index).
- Momentum Indicators: These indicators measure the speed and strength of price changes. Examples include RSI, Stochastic Oscillator, and Rate of Change (ROC).
- Volatility Indicators: These indicators measure the degree of price fluctuation. Examples include Bollinger Bands, Average True Range (ATR), and volatility index (VIX).
Risk Management and Position Sizing in Forex

Forex trading, while potentially lucrative, is inherently risky. Success isn’t just about predicting market movements; it’s about managing risk effectively to protect your capital and ensure long-term profitability. This section delves into the crucial aspects of risk management and position sizing, vital components of a successful forex trading strategy.
Stop-Loss Orders and Take-Profit Levels
Stop-loss orders and take-profit levels are fundamental risk management tools. A stop-loss order automatically closes a trade when the price reaches a predetermined level, limiting potential losses. Conversely, a take-profit order automatically closes a trade when the price reaches a specified level, securing profits. Setting these orders before entering a trade is crucial; it removes emotion from decision-making during market volatility. For example, if you buy EUR/USD at 1.1000, you might set a stop-loss at 1.0970 (limiting loss to 30 pips) and a take-profit at 1.1050 (targeting a 50-pip profit). This approach defines your risk and reward parameters upfront.
Position Sizing Based on Risk Tolerance and Account Equity
Determining the appropriate position size is crucial for managing risk. It involves calculating the amount of currency to trade based on your risk tolerance and account equity. A common approach is to risk a fixed percentage of your account equity per trade, typically 1-2%. For instance, with a $10,000 account and a 1% risk tolerance, your maximum loss per trade should be $100. If your stop-loss is 30 pips, you need to calculate the position size that results in a $100 loss at that pip level. This calculation varies depending on the broker’s leverage and pip value. Sophisticated position size calculators are readily available online to assist with this process. Over-leveraging, exceeding your risk tolerance, can quickly lead to substantial losses.
Diversification in Forex Trading
Diversification is a powerful risk mitigation strategy. Instead of concentrating your capital in a single currency pair, spread your investments across multiple pairs. This reduces the impact of a single losing trade or unfavorable market movement in one specific currency. For example, instead of only trading EUR/USD, consider adding pairs like GBP/USD, USD/JPY, and AUD/USD to your portfolio. However, diversification doesn’t eliminate risk; it simply helps to manage and reduce its overall impact. The level of diversification depends on your risk appetite and trading style.
Hypothetical Trading Scenario and Risk Management
Let’s consider a hypothetical scenario. Suppose you have a $5,000 account and a 2% risk tolerance. You decide to trade GBP/USD. Your analysis suggests a potential upward trend, and you enter a long position at 1.2500. You set a stop-loss order at 1.2470 (30 pips), representing a maximum loss of $60 (2% of $3000, assuming a standard lot size and pip value). Your take-profit order is placed at 1.2550 (50 pips), targeting a $100 profit. This demonstrates a clearly defined risk-reward ratio of 1:1.67. Even if the trade moves against you, your potential loss is carefully controlled, protecting your overall capital. This methodical approach is paramount for sustainable trading success.
Analyzing Market Sentiment and News Impact
Predicting forex market movements effectively requires understanding how news events and overall market sentiment influence currency pairs. Ignoring these factors can lead to significant losses, as unexpected shifts in market mood can dramatically alter price trajectories. This section explores how to interpret news and utilize sentiment indicators to improve your trading decisions.
Interpreting News Events and Their Impact on Currency Pairs
News events, from economic data releases to geopolitical shifts, can significantly impact currency values. A strong economic report for a country might boost its currency, while political instability could cause a sharp decline. Understanding which news items are market-movers and how they’re likely to affect specific currency pairs is crucial. For instance, positive US employment data generally strengthens the US dollar (USD) against other currencies. Conversely, negative inflation data from the Eurozone might weaken the Euro (EUR) relative to the USD. The key is to identify the potential impact of a news event *before* it occurs, allowing for proactive trading adjustments.
Impact of Economic Data Releases
Economic indicators, such as inflation rates, GDP growth, unemployment figures, and interest rate decisions, are major drivers of currency movements. A higher-than-expected inflation rate, for example, might lead a central bank to raise interest rates. This can attract foreign investment, increasing demand for the currency and pushing its value higher. Conversely, weaker-than-expected data often leads to the opposite effect. Traders carefully analyze these releases, often using economic calendars to track upcoming events and their potential impact. A surprise increase in US interest rates, for instance, could lead to a rapid appreciation of the USD against other major currencies like the EUR or JPY.
Analyzing Geopolitical Events, How to Predict Forex Market Movements
Geopolitical events, such as wars, political instability, or trade disputes, can also dramatically affect currency markets. Uncertainty surrounding these events often causes increased volatility and significant price swings. For example, a major geopolitical crisis in a specific region might cause investors to move their funds to safer havens, like the USD or Japanese Yen (JPY), leading to a surge in demand for these currencies. Conversely, positive developments in a region could boost its local currency. It’s essential to stay informed about global events and assess their potential implications for your trading strategies.
Utilizing Sentiment Indicators
Market sentiment reflects the overall mood of investors towards a particular currency or market. While not a perfect predictor, understanding sentiment can provide valuable insights.
Social Media Sentiment Analysis
Social media platforms like Twitter and Reddit can offer a real-time pulse on market sentiment. Analyzing the sentiment expressed in relevant tweets or forum discussions can help gauge the prevailing mood. However, it’s crucial to approach this with caution, as social media sentiment can be easily manipulated or reflect the opinions of a small, non-representative group. Tools and algorithms can help to analyze large volumes of social media data and identify trending sentiment.
News Headline Sentiment
News headlines and articles often reflect prevailing market sentiment. Positive news tends to correlate with bullish sentiment, while negative news often suggests bearish sentiment. Monitoring news sources from reputable financial news outlets can provide a valuable, albeit potentially lagging, indication of market mood. However, remember that media bias can influence the presentation of news, so it’s crucial to analyze information from multiple sources.
Unexpected News Events and Price Swings
Unexpected news events often cause significant price swings. The Brexit vote in 2016 is a prime example. The unexpected outcome led to a sharp devaluation of the British Pound (GBP) against other major currencies, creating significant opportunities and risks for forex traders. Similarly, the COVID-19 pandemic in 2020 caused widespread market volatility, with many currencies experiencing dramatic price swings as investors reacted to the uncertainty. These examples highlight the importance of staying informed and adapting trading strategies to account for unpredictable events.
System for Tracking News and Sentiment Data
Developing a robust system for tracking news and sentiment data is essential. This might involve:
* Utilizing economic calendars: These calendars provide schedules of upcoming economic data releases.
* Following reputable financial news sources: This ensures access to timely and accurate information.
* Employing sentiment analysis tools: These tools can help analyze large volumes of social media data and news articles.
* Maintaining a trading journal: This helps track your trades and the news events that influenced them.
By combining these approaches, traders can build a more comprehensive understanding of market sentiment and the potential impact of news events on their forex trades. Remember, effective risk management remains crucial even with thorough news and sentiment analysis.
Backtesting and Evaluating Trading Strategies
Backtesting is the crucial process of testing your forex trading strategy on historical data to assess its potential profitability and identify weaknesses before risking real capital. It’s like a dry run for your trading plan, allowing you to refine it and improve your chances of success in the live market. Without rigorous backtesting, deploying a strategy is akin to sailing without a map – you might get lucky, but you’re more likely to encounter significant challenges.
Backtesting involves applying your trading rules to past market data, simulating trades and recording the outcomes. This allows you to evaluate various aspects of your strategy’s performance and identify areas needing improvement. The process, while seemingly straightforward, requires careful attention to detail and a robust approach to avoid misleading results.
Backtesting a Forex Trading Strategy Using Historical Data
To effectively backtest, you need access to historical forex data, which includes price charts (at least OHLC – Open, High, Low, Close data) and potentially volume information. Many brokers provide this data, or you can find it through specialized financial data providers. The quality and granularity of the data are crucial – using inaccurate or insufficient data will lead to flawed results. The chosen timeframe for the backtest is also important; testing on a short timeframe might not reveal long-term trends, while testing on an excessively long timeframe might obscure recent market dynamics. It’s best to test over a period that’s representative of the market conditions you expect to encounter.
A systematic approach is key. You’ll input your trading strategy’s rules – entry and exit signals, stop-loss and take-profit levels – into your backtesting software or spreadsheet. The software will then simulate trades based on the historical data, generating a performance report. Manual backtesting is possible but extremely time-consuming and prone to errors, especially with complex strategies.
Evaluating Trading Strategy Performance
Several key metrics help evaluate a strategy’s performance. These metrics provide a quantitative assessment, helping you compare different strategies and identify areas for improvement.
Win Rate: This represents the percentage of trades that resulted in a profit. A high win rate is generally desirable, but it’s not the sole indicator of success. A strategy with a low win rate but high average profit per trade can still be profitable.
Profit Factor: This is the ratio of total profits to total losses. A profit factor greater than 1 indicates that the strategy generated more profit than loss. A higher profit factor generally suggests a more robust strategy. The formula is:
Profit Factor = Total Profits / Total Losses
Maximum Drawdown: This metric identifies the largest peak-to-trough decline during the backtesting period. It represents the maximum loss experienced before the strategy recovered. A lower maximum drawdown indicates better risk management.
Average Trade Profit/Loss: These figures provide insights into the typical profit or loss per trade. A positive average trade profit is obviously desirable.
Common Pitfalls in Backtesting
Over-optimization: This occurs when you repeatedly tweak your strategy to fit the historical data, leading to a strategy that performs well in the past but poorly in the future. This is a common trap, and it’s vital to avoid it. Use a portion of the data for optimization and another for out-of-sample testing.
Curve Fitting: Similar to over-optimization, curve fitting involves adjusting the strategy to match the specific characteristics of the historical data, leading to poor generalization. Use techniques like walk-forward analysis to mitigate this.
Ignoring Transaction Costs: Real-world trading involves commissions, slippage, and spreads. Ignoring these costs in backtesting will lead to overly optimistic results. Incorporate realistic transaction costs in your backtesting process.
Data Mining Bias: Selecting specific periods of historical data that favor your strategy can lead to biased results. Test your strategy across different market conditions and timeframes.
Comparative Performance of Forex Trading Strategies
The following table compares the performance metrics of three hypothetical forex trading strategies: A simple moving average crossover, a relative strength index (RSI) based strategy, and a strategy combining both indicators. Note: These are hypothetical examples and actual performance may vary significantly.
| Strategy | Win Rate (%) | Profit Factor | Maximum Drawdown (%) |
|---|---|---|---|
| Simple Moving Average Crossover | 55 | 1.5 | 10 |
| RSI-Based Strategy | 60 | 1.8 | 8 |
| Combined Strategy | 65 | 2.1 | 6 |
The Role of Psychology in Forex Trading
Forex trading isn’t just about charts and indicators; it’s a deeply psychological game. Success hinges not only on your analytical skills but also on your ability to manage your emotions and maintain discipline in the face of market volatility. Ignoring the psychological aspect can lead to devastating losses, even with the most sophisticated trading strategies.
Understanding and mastering your psychology is crucial for long-term profitability. The forex market is inherently unpredictable, and emotional reactions often lead to impulsive decisions that contradict your well-laid plans. This section will explore the common psychological challenges faced by traders and provide strategies to overcome them.
Psychological Challenges in Forex Trading
Fear, greed, and overconfidence are the notorious enemies of disciplined trading. Fear can cause traders to exit profitable positions prematurely, locking in small profits instead of letting them grow. Greed, on the other hand, can lead to holding onto losing positions for too long, hoping for a reversal that may never come. Overconfidence, fueled by a few successful trades, can lead to excessive risk-taking and ultimately, significant losses. These emotions, if unchecked, can derail even the most meticulously crafted trading plans.
Strategies for Managing Emotions and Maintaining Discipline
Developing emotional intelligence is paramount in forex trading. This involves recognizing your emotional state, understanding its impact on your trading decisions, and implementing strategies to mitigate its negative effects. Techniques like mindfulness and meditation can help you center yourself and make more rational choices. Keeping a detailed trading journal, recording both successful and unsuccessful trades along with the emotions you experienced, can provide valuable insights into your behavioral patterns. Regularly reviewing this journal can help identify triggers and develop strategies to avoid repeating past mistakes. Furthermore, setting realistic profit targets and stop-loss orders can help manage risk and prevent emotional overreactions to market fluctuations.
The Importance of a Robust Trading Plan
A well-defined trading plan acts as your emotional anchor in the turbulent waters of the forex market. It should Artikel your trading strategy, risk management rules, position sizing techniques, and psychological guidelines. The plan should be specific, measurable, achievable, relevant, and time-bound (SMART). Sticking to your trading plan, regardless of market conditions or emotional impulses, is critical for consistent performance. It provides a framework for decision-making, reducing the influence of emotions and biases. Regularly reviewing and adapting your plan as your experience and market conditions change is also essential.
Common Psychological Biases in Forex Trading
Understanding common psychological biases is crucial for improving trading performance. These biases can significantly distort your perception of market realities and lead to suboptimal decisions.
- Confirmation Bias: Seeking out information that confirms pre-existing beliefs and ignoring contradictory evidence.
- Overconfidence Bias: Overestimating one’s own abilities and knowledge, leading to excessive risk-taking.
- Availability Heuristic: Overemphasizing recent or easily recalled events, leading to skewed perceptions of market probabilities.
- Anchoring Bias: Over-relying on the first piece of information received, influencing subsequent decisions.
- Loss Aversion: Feeling the pain of a loss more strongly than the pleasure of an equivalent gain, leading to holding onto losing positions for too long.
Recognizing these biases and actively working to mitigate their influence is a crucial step towards becoming a more successful and emotionally resilient forex trader. By consistently applying the strategies discussed above, traders can improve their emotional control, make more rational decisions, and ultimately increase their chances of achieving long-term profitability in the forex market. For example, a trader might initially believe a certain currency pair will appreciate (confirmation bias). However, if they consistently stick to their trading plan, including predetermined stop-loss orders, they can limit potential losses and avoid emotional trading decisions.
Closing Summary: How To Predict Forex Market Movements
Predicting forex market movements isn’t a guaranteed path to riches, but understanding the underlying principles and employing sound strategies significantly improves your chances of success. This guide provided a comprehensive overview of fundamental and technical analysis, risk management, and the psychological aspects of trading. Remember, consistent learning, disciplined execution, and adapting to market changes are key to navigating the complexities of the forex market. While this journey demands patience and perseverance, the potential rewards can be substantial for those who dedicate themselves to mastering the art of forex trading. So, are you ready to sharpen your skills and take control of your trading destiny?
General Inquiries
What’s the difference between fundamental and technical analysis?
Fundamental analysis focuses on macroeconomic factors (economic data, political events) affecting currency values, while technical analysis uses charts and indicators to identify price trends and patterns.
How can I stay updated on market news?
Utilize reputable financial news websites, economic calendars, and forex-specific news sources. Consider setting up alerts for key economic releases.
Is it possible to predict forex movements with 100% accuracy?
No, the forex market is inherently unpredictable. Strategies aim to increase the probability of successful trades, not guarantee profits.
What’s the best indicator for forex trading?
There’s no single “best” indicator. The effectiveness of an indicator depends on the market conditions and your trading strategy. Experiment to find what works best for you.
How much money do I need to start forex trading?
The amount needed depends on your risk tolerance and trading strategy. Start with a demo account to practice before investing real money.
Obtain access to The Role of News in Forex Trading to private resources that are additional.
Do not overlook explore the latest data about Can Forex Trading Be a Full-Time Job?.
