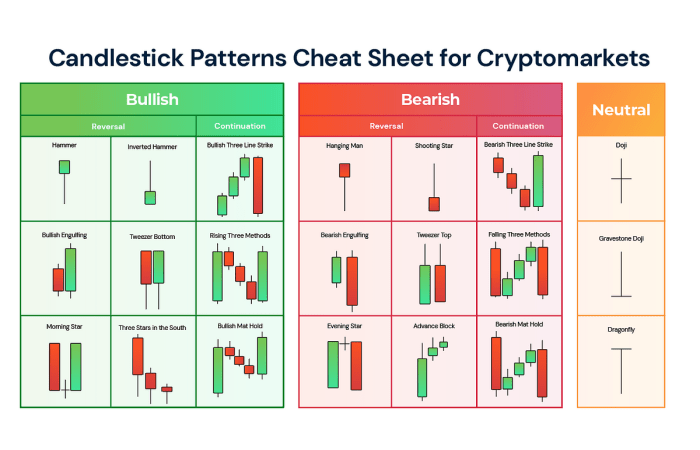
How to Trade Forex Using Candlestick Patterns: Unlock the secrets of the financial markets! This isn’t your grandpa’s investment guide; we’re diving deep into the world of forex trading, using candlestick patterns to predict market movements and potentially rake in some serious profits. We’ll decode those cryptic charts, transforming you from a forex newbie to a pattern-recognizing pro. Get ready to learn how to spot bullish and bearish signals, combine candlestick analysis with other indicators, and manage risk like a seasoned trader. Buckle up, because this ride’s gonna be wild.
We’ll cover everything from the basics of forex and candlestick charts to advanced pattern recognition techniques. Learn to identify common bullish and bearish patterns, understand the market conditions that precede them, and see real-world examples of successful trades. We’ll show you how to combine candlestick patterns with other technical indicators for even higher accuracy, and crucially, how to manage risk effectively to protect your hard-earned cash. By the end, you’ll be equipped with the knowledge and confidence to navigate the exciting – and sometimes unpredictable – world of forex trading.
Introduction to Forex and Candlestick Charts

Forex trading, or foreign exchange trading, is the global marketplace where currencies are bought and sold. It’s a massive, decentralized market operating 24/5, offering opportunities for significant profits but also considerable risk. Understanding the fundamentals of forex and how to interpret candlestick charts is crucial for navigating this dynamic environment. This section will equip you with the basic knowledge needed to begin your forex trading journey.
Forex Trading Basics
Forex trading involves speculating on the value of one currency against another. For example, you might buy the Euro (EUR) against the US Dollar (USD), hoping the Euro will appreciate in value relative to the dollar. Your profit (or loss) is determined by the difference between the buying and selling price, multiplied by the amount of currency traded. The exchange rate constantly fluctuates due to various economic and political factors, creating both opportunities and challenges for traders. Leverage is commonly used in forex trading, magnifying both potential profits and losses. Therefore, risk management is paramount.
Candlestick Chart Components
Candlestick charts are a visual representation of price movements over time. Each candlestick represents a specific time period (e.g., one hour, one day). The candlestick’s body shows the opening and closing prices, while the wicks (or shadows) indicate the high and low prices during that period.
A visual representation: Imagine a vertical rectangle (the body). The top of the body shows the closing price; the bottom shows the opening price. If the closing price is higher than the opening price, the body is filled (usually green or white), indicating an “up” candle. If the closing price is lower than the opening price, the body is hollow (usually red or black), indicating a “down” candle. Thin lines extending above and below the body are the wicks; the top wick shows the highest price reached, and the bottom wick shows the lowest price reached during the period.
Candlestick Patterns
Understanding candlestick patterns is key to predicting potential price movements. These patterns often provide insights into market sentiment and momentum. While not foolproof predictors, they can enhance your trading decisions when used in conjunction with other technical analysis tools.
| Pattern Name | Description | Interpretation |
|---|---|---|
| Bullish Engulfing | A long green candle completely engulfs a preceding red candle. | Suggests a potential bullish reversal. |
| Bearish Engulfing | A long red candle completely engulfs a preceding green candle. | Suggests a potential bearish reversal. |
| Hammer | A small body with a long lower wick, and a relatively short or nonexistent upper wick. | Indicates a potential bullish reversal at the bottom of a downtrend. |
| Hanging Man | Similar to a hammer but appears at the top of an uptrend. | Indicates a potential bearish reversal. |
| Shooting Star | A small body with a long upper wick and a relatively short or nonexistent lower wick, appearing at the top of an uptrend. | Indicates a potential bearish reversal. |
Identifying Bullish Candlestick Patterns
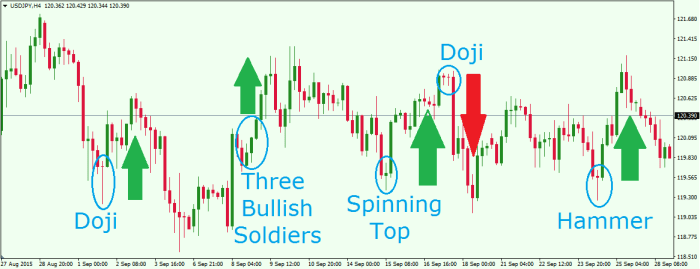
Spotting bullish candlestick patterns is like finding hidden treasure in the forex market. These patterns signal potential price increases, giving savvy traders a heads-up on potential profit opportunities. Understanding these patterns requires a keen eye for detail and a grasp of the underlying market dynamics. Let’s dive into three common bullish patterns that can significantly enhance your trading strategy.
Bullish Engulfing Pattern
The bullish engulfing pattern is a two-candlestick formation signaling a potential reversal from a downtrend. It occurs when a large bullish candle completely engulfs the previous bearish candle. The larger the engulfing candle, the stronger the bullish signal. This pattern suggests that buyers are stepping in and overpowering the sellers, potentially marking the start of an uptrend. The market conditions preceding this pattern usually involve a period of bearish momentum, often characterized by lower lows and lower highs. As the selling pressure begins to wane, buyers gain the upper hand, leading to the engulfing candle.
For example, imagine a EUR/USD pair showing a consistent downtrend. Then, a large bullish candle appears, completely covering the previous bearish candle’s body. This visually represents a shift in market sentiment, from bearish to bullish. A trader might enter a long position (buying EUR/USD) with a stop-loss order placed below the low of the engulfing candle, aiming to capitalize on the potential uptrend. The potential profit target could be set based on technical analysis, such as the height of the engulfing candle projected upwards from its high.
Hammer Pattern
The hammer is a single-candlestick pattern indicating a potential bullish reversal. It’s characterized by a small body near the top of its range, with a long lower shadow (wick) at least twice the length of the body, and a relatively short or nonexistent upper shadow. The long lower shadow suggests strong buying pressure that pushed the price back up after a period of selling. This pattern often emerges after a period of sustained price decline, signaling a possible exhaustion of selling pressure.
Consider a GBP/USD pair experiencing a consistent downtrend. A hammer candlestick appears with a small body near the top of its range and a long lower wick, demonstrating buyers stepping in to prevent further price decline. A trader might initiate a long position (buying GBP/USD) with a stop-loss order placed just below the hammer’s low. The potential profit target might be set at a level based on risk-reward ratio or other technical indicators, such as the height of the hammer projected upwards.
Piercing Pattern
The piercing pattern is a two-candlestick bullish reversal pattern that appears at the end of a downtrend. It’s composed of a long bearish candle followed by a bullish candle that opens lower than the bearish candle’s close but closes at least halfway up the bearish candle’s body. This signifies that buyers are starting to gain momentum, overcoming the selling pressure. The market conditions leading up to this pattern often include a noticeable downtrend, with sellers appearing dominant. The piercing pattern suggests the potential exhaustion of the downtrend and a shift towards a bullish sentiment.
For instance, observe a USD/JPY pair in a clear downtrend. A piercing pattern emerges: a long bearish candle is followed by a bullish candle opening lower but closing significantly higher within the body of the bearish candle. A trader might enter a long position (buying USD/JPY), placing a stop-loss order below the low of the bullish candle. The profit target could be determined using techniques like measuring the length of the bullish candle and projecting it upwards from the high.
Comparison of Bullish Candlestick Patterns
| Pattern | Candlestick Composition | Market Conditions | Reliability |
|---|---|---|---|
| Bullish Engulfing | Two candles: Bearish followed by a larger bullish candle engulfing the previous one. | Downtrend exhaustion | Moderately High |
| Hammer | One candle: Small body near the top, long lower shadow. | Downtrend exhaustion | Moderate |
| Piercing Pattern | Two candles: Bearish candle followed by a bullish candle that closes at least halfway up the bearish candle’s body. | Downtrend exhaustion | Moderate |
Identifying Bearish Candlestick Patterns
Spotting bearish candlestick patterns is crucial for savvy forex traders. These patterns signal potential price reversals from upward trends, offering opportunities to capitalize on downward movements. Understanding these patterns, along with accompanying market signals, can significantly improve your trading accuracy and risk management. Let’s dive into three common bearish patterns and explore how to use them to your advantage.
Bearish Engulfing Pattern, How to Trade Forex Using Candlestick Patterns
The bearish engulfing pattern is a two-candlestick reversal pattern indicating a potential shift from a bullish trend to a bearish one. The first candle is a bullish candle, typically a long green candle, representing upward momentum. The second candle is a bearish candle that completely engulfs the first candle, both in terms of its body and its wicks (shadows). This engulfment visually represents the bears overpowering the bulls, suggesting a likely price decline. The larger the engulfing candle, the stronger the bearish signal. Successful trades using this pattern often involve placing a sell order at the close of the engulfing candle or slightly below it, with a stop-loss order placed above the high of the first candle.
Evening Star Pattern
The Evening Star pattern is a three-candlestick reversal pattern, also indicating a potential shift from an uptrend to a downtrend. It’s characterized by a long bullish candle followed by a relatively small, indecisive candle (doji or spinning top) near the high of the previous candle. Finally, a significant bearish candle appears, closing substantially lower than the opening of the small indecisive candle. This pattern signals weakening bullish momentum, culminating in a strong bearish move. Traders often look for confirmation signals, such as increased trading volume on the bearish candle, before executing a sell order near the low of the third candle. The stop-loss would typically be placed above the high of the first candle.
Bearish Harami Pattern
The Bearish Harami pattern is a two-candlestick reversal pattern, suggesting a potential reversal from an uptrend. The first candle is a long bullish candle, demonstrating strong upward momentum. The second candle is a small bearish candle, completely contained within the body of the first candle. This small body within the larger body resembles a ‘pregnant woman’ hence its alternative name. This signifies a loss of bullish momentum and a potential shift in market sentiment towards bearishness. While not as strong a signal as the engulfing or evening star, it can still be a valuable indicator when combined with other confirming signals, such as bearish divergence in indicators (like RSI or MACD). A sell order could be placed near the low of the second candle, with the stop-loss order placed above the high of the first candle.
Examples of Successful Forex Trades Based on Bearish Patterns
Successful forex trading using bearish candlestick patterns requires careful analysis and risk management. The following examples illustrate potential trade setups, but remember that past performance is not indicative of future results.
- Example 1: Bearish Engulfing on EUR/USD: Imagine a EUR/USD chart showing a long bullish green candle followed by a larger bearish red candle completely engulfing the green one. A trader might have placed a sell order at the close of the bearish candle, with a stop-loss above the high of the green candle. If the price subsequently dropped significantly, the trader would have profited. The chart would visually depict the engulfment and the subsequent price decline.
- Example 2: Evening Star on GBP/USD: Consider a GBP/USD chart displaying a long bullish candle, followed by a small doji candle near the high, and finally, a significant bearish candle closing well below the doji’s open. A trader might have placed a sell order near the low of the bearish candle, with a stop-loss placed above the high of the first bullish candle. A successful trade would show the price declining after the bearish candle.
- Example 3: Bearish Harami on USD/JPY: On a USD/JPY chart, a long bullish candle is followed by a smaller bearish candle completely inside the body of the first candle. A trader might have placed a sell order near the low of the small bearish candle, with a stop-loss above the high of the first candle. The subsequent price movement would determine the success of this trade, potentially showing a decline after the Harami pattern.
Combining Candlestick Patterns with Other Indicators
Candlestick patterns, while powerful on their own, become even more potent when combined with other technical indicators. This synergistic approach significantly improves the accuracy and reliability of your trading signals, reducing the risk of false breakouts and enhancing your overall trading strategy. By integrating multiple analytical tools, you gain a more comprehensive view of market dynamics, leading to better-informed trading decisions.
Using candlestick patterns in isolation can sometimes lead to inaccurate predictions due to market noise and volatility. However, by combining them with other indicators like moving averages or the Relative Strength Index (RSI), you can confirm the validity of the candlestick signal and filter out less reliable patterns. This combined approach helps identify higher-probability trading setups, enhancing your chances of successful trades.
Moving Averages and Candlestick Patterns
Moving averages provide a clear indication of the prevailing trend. Combining them with candlestick patterns helps confirm the trend and identify potential reversal points. For instance, a bullish engulfing pattern appearing after a period of downtrend confirmed by a downward-sloping moving average suggests a strong potential for a trend reversal. Conversely, a bearish engulfing pattern occurring during an uptrend, as indicated by an upward-sloping moving average, might signal a weakening trend or an impending reversal. The interaction between the pattern and the moving average helps filter out false signals. A strong bullish engulfing pattern appearing near the support level of a moving average might be a more reliable buy signal than one appearing far away from any significant support.
RSI and Candlestick Patterns
The Relative Strength Index (RSI) is a momentum indicator that measures the speed and change of price movements. Combining RSI with candlestick patterns helps assess the strength of the underlying trend and identify potential overbought or oversold conditions. For example, a bullish hammer candlestick pattern appearing at an oversold level (RSI below 30) suggests a potential bounce, increasing the probability of a successful long position. Similarly, a bearish candlestick pattern like a shooting star appearing at an overbought level (RSI above 70) could signal a potential sell opportunity. The RSI adds a crucial layer of confirmation, preventing entries based solely on candlestick patterns that might be misleading in the context of market momentum.
Combined Indicator Strategies and Potential Outcomes
The following table illustrates various combinations of candlestick patterns and indicators, along with their potential outcomes. Remember that these are potential outcomes and not guaranteed results; market conditions and individual asset behavior always play a crucial role.
| Candlestick Pattern | Indicator | Potential Outcome | Example |
|---|---|---|---|
| Bullish Engulfing | 20-period EMA crossing above 50-period EMA | Strong buy signal, potential uptrend | A bullish engulfing pattern forms after the 20-period EMA crosses above the 50-period EMA, suggesting a shift in momentum towards an uptrend. |
| Bearish Engulfing | RSI above 70 | Strong sell signal, potential downtrend | A bearish engulfing pattern forms while the RSI is above 70, indicating overbought conditions and a potential price reversal. |
| Hammer | RSI below 30 | Buy signal, potential bounce | A hammer candlestick appears at the end of a downtrend with the RSI below 30, suggesting an oversold market and a potential bounce. |
| Shooting Star | 20-period SMA acting as resistance | Sell signal, potential price drop | A shooting star forms near the resistance of a 20-period simple moving average, suggesting a potential price drop. |
Risk Management and Trading Strategies: How To Trade Forex Using Candlestick Patterns
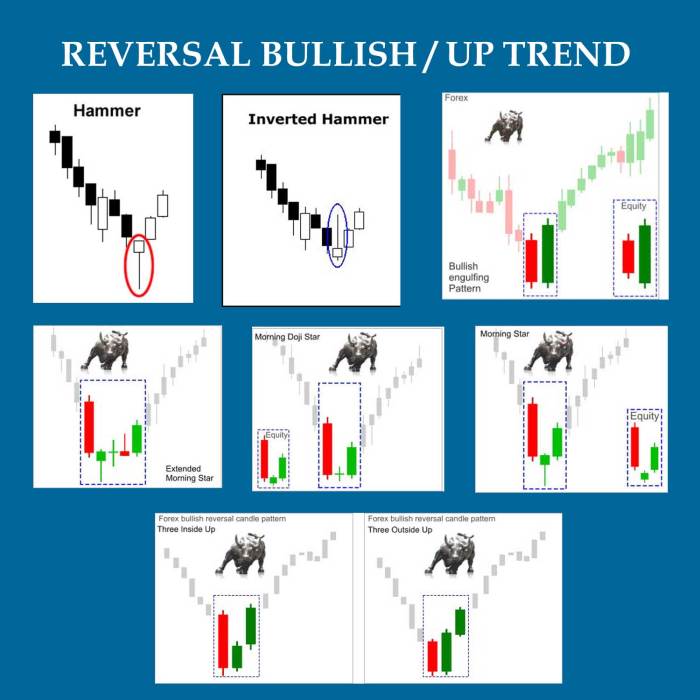
Forex trading, even when armed with the sharpest candlestick pattern analysis, is inherently risky. Profitable trading isn’t just about identifying promising patterns; it’s about managing risk effectively to protect your capital and ensure long-term success. This section details crucial risk management techniques and Artikels a sample trading plan to integrate these principles into your forex strategy.
Successful forex trading hinges on a robust risk management plan. Ignoring this critical aspect can quickly lead to substantial losses, wiping out your trading account before you can even see the fruits of your candlestick pattern expertise. A well-defined strategy protects your capital, allowing you to stay in the game long enough to learn, adapt, and ultimately profit.
Position Sizing and Stop-Loss Orders
Position sizing and stop-loss orders are fundamental components of effective risk management. Position sizing determines the amount of capital allocated to each trade, limiting potential losses per trade. Stop-loss orders automatically exit a trade when the price reaches a predetermined level, minimizing potential losses. These two elements work synergistically to control risk and protect your trading capital. For example, a trader might risk only 1% of their account balance on any single trade, regardless of the potential profit. This 1% limit would then determine the size of their position and the placement of their stop-loss order. A stop-loss order set at a level that would result in a 1% loss protects the account from a significant drawdown.
Developing a Sample Trading Plan
A well-structured trading plan is essential for consistent profitability. This plan should incorporate your candlestick pattern analysis, risk management strategies, and trading psychology. A sample plan might look like this:
- Market Analysis: Identify potential trading opportunities using candlestick patterns (e.g., engulfing patterns, hammer patterns). Consider relevant economic news and market sentiment.
- Entry Strategy: Define precise entry points based on candlestick patterns and confirmation signals from other indicators (e.g., moving averages, RSI).
- Position Sizing: Risk no more than 1-2% of your trading capital on any single trade. This limits potential losses and allows for a series of losing trades without significant account erosion.
- Stop-Loss Order: Place a stop-loss order to limit potential losses to your predetermined risk percentage. The stop-loss order should be placed strategically, considering factors such as support levels and candlestick pattern characteristics.
- Take-Profit Order: Determine a take-profit level based on your risk-reward ratio (e.g., a 1:2 risk-reward ratio). This level should be set based on price targets derived from your candlestick pattern analysis and market conditions.
- Trade Management: Monitor your trades actively and adjust your stop-loss orders or take-profit orders if necessary. Consider trailing stop-losses to lock in profits as the price moves in your favor.
- Record Keeping: Maintain a detailed trading journal, recording your trades, rationale, and results. This journal helps you to identify patterns in your trading, optimize your strategies, and learn from your mistakes.
Steps for Effective Risk Management
Effective risk management is not a one-time event but a continuous process that requires discipline and vigilance. Following these steps will help you to create a robust risk management framework:
- Define your risk tolerance: Determine the maximum percentage of your capital you are willing to lose on any given trade or within a specific time frame.
- Use stop-loss orders consistently: Never enter a trade without a predefined stop-loss order. This protects your capital from unexpected market movements.
- Diversify your trades: Avoid concentrating your capital in a single trade or currency pair. Spread your risk across multiple trades to reduce the impact of any single losing trade.
- Monitor your performance regularly: Track your trading performance closely and adjust your risk management strategy as needed. Regular review allows for timely adjustments based on market conditions and your trading performance.
- Stick to your trading plan: Avoid emotional trading decisions. Adhering to your pre-defined trading plan helps to maintain discipline and reduce impulsive risk-taking.
- Continuously learn and adapt: The forex market is dynamic. Stay updated on market trends and refine your risk management strategy as you gain experience.
Advanced Candlestick Pattern Recognition
Mastering the basics of candlestick patterns is crucial for forex trading success, but true expertise lies in recognizing and interpreting more complex formations. These advanced patterns, while less frequent, can offer incredibly powerful insights into market sentiment and potential price movements. Understanding their nuances, along with their limitations, is key to leveraging them effectively.
Three Less Common, Yet Powerful Candlestick Patterns
Three advanced candlestick patterns that often go unnoticed but can signal significant market shifts are the Three Inside Up/Down, the Engulfing Pattern (with specific criteria), and the Harami Cross. These patterns, when correctly identified within the context of broader market trends and supporting indicators, can significantly improve your trading accuracy.
Three Inside Up/Down Pattern Characteristics and Interpretation
The Three Inside Up/Down pattern consists of three consecutive candlesticks where the second and third candles are entirely contained within the body of the first candle. An “up” pattern indicates a potential bullish reversal, while a “down” pattern suggests a bearish reversal. The key is the context; a Three Inside Up pattern in a downtrend is far more significant than one in an already established uptrend. The size and strength of the candles are also critical; smaller, indecisive candles within a larger, dominant candle suggest stronger potential for a reversal.
Engulfing Pattern with Specific Criteria
The Engulfing pattern, a common pattern, becomes significantly more powerful when specific criteria are met. A bullish engulfing pattern occurs when a large bullish candle completely engulfs the previous bearish candle, indicating a potential shift in momentum. Conversely, a bearish engulfing pattern sees a large bearish candle engulfing a preceding bullish candle. The significance is amplified when the engulfing candle has a significantly larger body and volume than the previous candle, confirming a strong shift in market sentiment. The pattern is more reliable in trending markets; a bullish engulfing in a downtrend is a strong signal.
Harami Cross Pattern Explanation and Application
The Harami Cross is a two-candlestick pattern where a small, indecisive candle (the “Harami”) appears after a larger, directional candle. The “cross” refers to the small candle’s body crossing the midpoint of the previous candle’s body. A bullish Harami Cross appears after a bearish candle, suggesting a potential bullish reversal, while a bearish Harami Cross follows a bullish candle, hinting at a potential bearish reversal. This pattern is particularly useful in identifying potential exhaustion points in a trend. Confirmation from other indicators is crucial to minimize false signals.
Examples of Trades Using Advanced Patterns and Potential Pitfalls
Consider a scenario where the Three Inside Up pattern appears at a significant support level in a downtrend. A trader might enter a long position, setting a stop-loss below the support level. If the pattern is confirmed by other indicators, like positive volume or a bullish divergence in the RSI, the trade’s potential for success increases. However, a failure to confirm the pattern with additional indicators, or entering the trade too early, could lead to losses. Similarly, a bearish engulfing pattern appearing at a resistance level, coupled with bearish divergence, could signal a short trade. However, ignoring the broader market context or disregarding volume could lead to a false signal and losses. The Harami Cross, while often less definitive than engulfing patterns, can offer timely entries or exits. A bullish Harami Cross, for example, might signal a good opportunity to enter a long position during a temporary pullback in an uptrend. But a lack of confirmation could result in a missed opportunity or even a loss.
Comparative Analysis of Advanced and Common Candlestick Patterns
| Pattern | Reliability | Confirmation Needs | Market Context |
|---|---|---|---|
| Three Inside Up/Down | Moderate | Volume, other indicators | Reversal in established trend |
| Engulfing (Strong Criteria) | High | Volume, strong candle body | Trend continuation or reversal |
| Harami Cross | Low to Moderate | Volume, other indicators, trend confirmation | Trend exhaustion or minor reversal |
| Hammer/Inverted Hammer | Moderate | Volume, support/resistance | Reversal at support/resistance |
| Doji | Low | Strong confirmation from other indicators | Indecision, potential reversal |
Practical Application and Case Studies
Let’s move beyond the theory and dive into the real-world application of candlestick patterns in forex trading. This section presents detailed case studies showcasing successful trades, highlighting the decision-making process and the specific patterns utilized. Remember, past performance is not indicative of future results, and forex trading involves significant risk.
Successful forex trading using candlestick patterns requires a keen eye for detail, a disciplined approach to risk management, and the ability to interpret market context. These case studies illustrate how combining candlestick pattern recognition with other analytical tools can lead to profitable trading opportunities.
EUR/USD Long Position Based on Bullish Engulfing Pattern
This trade capitalized on a bullish engulfing pattern appearing after a period of consolidation. The previous day’s bearish candle was completely engulfed by a large bullish candle the following day, suggesting a shift in momentum. Entry was placed at the high of the engulfing candle, with a stop-loss below the low of the previous day’s bearish candle. The trade was exited at a predetermined profit target, based on a Fibonacci retracement level. The bullish engulfing pattern, coupled with positive RSI readings and upward sloping moving averages, significantly increased the probability of a price increase.
GBP/USD Short Position Based on Bearish Harami Pattern
A bearish Harami pattern formed at a significant resistance level, indicating a potential reversal in the uptrend. The first candle was a large bullish candle, followed by a smaller bearish candle completely contained within the body of the first candle. This pattern, combined with negative MACD divergence and overbought conditions on the RSI, signaled a high probability of a price decline. The short position was entered at the low of the smaller bearish candle, with a stop-loss above the high of the larger bullish candle. The trade was closed at a predetermined profit target, when the price reached a key support level.
USD/JPY Long Position Based on Morning Star Pattern
After a downtrend, a morning star pattern emerged, signaling a potential bullish reversal. This three-candle pattern consists of a bearish candle, followed by a small body candle, and then a bullish candle that gaps above the previous day’s high. This pattern, combined with support from a significant trendline and positive volume, suggested a likely price increase. The long position was entered at the high of the third candle, with a stop-loss below the low of the first candle. The trade was exited at a predetermined profit target, after the price broke through a previous resistance level.
Closing Summary
Mastering forex trading using candlestick patterns isn’t a get-rich-quick scheme; it’s about developing a keen eye for market trends and a disciplined approach to risk management. This guide has equipped you with the fundamental tools and strategies to begin your journey. Remember, consistent learning, practice, and a healthy dose of patience are key to success. So, grab your charts, hone your skills, and prepare to conquer the forex markets. The potential rewards are significant, but remember to always trade responsibly.
Questions Often Asked
What are the limitations of using only candlestick patterns?
Candlestick patterns alone aren’t foolproof. They’re most effective when combined with other technical indicators and a solid understanding of market context. Over-reliance on patterns can lead to false signals.
How long does it take to become proficient at reading candlestick patterns?
Proficiency takes time and dedicated practice. Consistent study and analyzing real-market data are crucial. Expect a learning curve, but with persistence, you’ll improve your pattern recognition skills.
Where can I find reliable data and charts for practice?
Many reputable brokers offer charting tools and historical data. TradingView is also a popular and powerful platform for charting and technical analysis.
Are there any specific personality traits that make someone better suited to forex trading?
Success in forex trading often involves patience, discipline, and the ability to manage risk effectively. Emotional control and a rational approach are essential to avoid impulsive decisions.
Explore the different advantages of The Most Important Forex Trading Indicators You Should Know that can change the way you view this issue.
Investigate the pros of accepting Best forex brokers with low spreads and commissions? in your business strategies.
