How to Use RSI in Forex Trading? Unlocking the secrets of this powerful indicator isn’t rocket science, but it does require understanding its nuances. We’ll break down the Relative Strength Index (RSI) – from its mathematical underpinnings to crafting winning trading strategies. Get ready to ditch the guesswork and start making smarter forex decisions.
This guide will walk you through calculating RSI, interpreting its signals (including those tricky divergences), and combining it with other indicators for a more robust approach. We’ll also cover crucial risk management techniques to protect your capital. By the end, you’ll be equipped to confidently incorporate RSI into your forex trading arsenal.
Introduction to RSI in Forex Trading
So, you’re diving into the world of Forex trading and want to understand the Relative Strength Index (RSI)? Excellent choice! RSI is a technical indicator that helps traders gauge the momentum of price movements and identify potential overbought and oversold conditions. Think of it as a sentiment gauge – it doesn’t predict the future, but it whispers clues about market extremes.
RSI, in its simplest form, measures the magnitude of recent price changes to evaluate overbought or oversold conditions in the price of a stock or other asset. It oscillates between 0 and 100, with readings above 70 generally considered overbought and readings below 30 considered oversold. This doesn’t mean a price reversal is guaranteed, but it suggests a potential turning point.
RSI’s History in Forex
While the RSI indicator was developed by J. Welles Wilder Jr. in the 1970s for commodities trading, its application quickly spread to other markets, including the dynamic world of Forex. Its adoption in Forex trading gained significant traction in the late 1980s and 1990s with the rise of technical analysis and the increasing accessibility of charting software. Initially, it was used primarily as a standalone tool for identifying potential trend reversals. Over time, its usage has become more sophisticated, often integrated with other indicators for improved accuracy and risk management. Traders found its ability to identify potential market tops and bottoms valuable, especially in fast-moving currency pairs.
RSI Application Across Different Forex Pairs
The effectiveness of RSI can vary across different forex pairs. Highly volatile pairs, like GBP/JPY or USD/JPY, might show frequent overbought/oversold readings, leading to more frequent false signals. Conversely, less volatile pairs, such as EUR/USD or USD/CHF, might display fewer extreme readings, potentially making RSI more reliable in identifying significant shifts in momentum. For example, a reading of 80 in GBP/JPY might be less indicative of an imminent reversal than the same reading in EUR/USD, simply due to the inherent volatility differences. Experienced traders often adjust their RSI settings (e.g., the period used for calculation) and incorporate other technical indicators to refine their trading decisions based on the specific characteristics of the currency pair they are analyzing. Consider the unique volatility profile of each pair when interpreting RSI signals.
Calculating RSI
The Relative Strength Index (RSI) isn’t some mystical prediction tool; it’s a momentum indicator calculated using a relatively straightforward formula. Understanding this formula is key to interpreting RSI values and integrating them effectively into your forex trading strategy. It helps you gauge the speed and change of price movements, providing insights into potential overbought or oversold conditions.
The RSI calculation hinges on the concept of average gains and average losses over a specific period. This average is then used to determine the relative strength of price movements.
RSI Formula and Calculation
The RSI is calculated using the following formula:
RSI = 100 – (100 / (1 + RS))
Where RS (Relative Strength) is:
RS = Average of upward price changes / Average of downward price changes
Let’s break down the calculation step-by-step with a sample dataset. We’ll use a 14-period RSI for this example, a commonly used timeframe. Remember, the “period” refers to the number of periods (e.g., days, hours) used in the calculation.
Sample RSI Calculation
Consider the following forex price data (Close Prices only, for simplicity):
| Date | Close | Upward Change | Downward Change |
|---|---|---|---|
| Day 1 | 1.1000 | – | – |
| Day 2 | 1.1050 | 0.0050 | – |
| Day 3 | 1.1020 | – | 0.0030 |
| Day 4 | 1.1080 | 0.0060 | – |
| Day 5 | 1.1100 | 0.0020 | – |
| Day 6 | 1.1070 | – | 0.0030 |
| Day 7 | 1.1090 | 0.0020 | – |
| Day 8 | 1.1120 | 0.0030 | – |
| Day 9 | 1.1150 | 0.0030 | – |
| Day 10 | 1.1130 | – | 0.0020 |
| Day 11 | 1.1160 | 0.0030 | – |
| Day 12 | 1.1180 | 0.0020 | – |
| Day 13 | 1.1200 | 0.0020 | – |
| Day 14 | 1.1190 | – | 0.0010 |
To calculate the 14-period RSI, we first calculate the average of upward changes and the average of downward changes over the 14 days. Then we compute RS and finally the RSI using the formula above. This process would be repeated for each subsequent day, using a rolling 14-day window. Note that the initial average calculation may use a different method (e.g., a simple average of the first 14 periods) compared to subsequent calculations.
Different RSI Calculation Periods
Using different periods (e.g., 9-period, 14-period) alters the RSI’s sensitivity. A shorter period (like 9) generates a more volatile RSI, reacting quicker to price changes. This makes it more susceptible to whipsaws (false signals). A longer period (like 14) produces a smoother RSI, less prone to whipsaws but potentially slower to react to significant market shifts. The choice of period depends on your trading style and the timeframe you are trading on. For example, scalpers might use a shorter period, while swing traders might prefer a longer one.
Interpreting RSI Signals
The Relative Strength Index (RSI) is a momentum indicator, and while it doesn’t predict price movements directly, it helps traders identify potential overbought and oversold conditions. Understanding these conditions is crucial for making informed trading decisions, but it’s vital to remember that RSI is just one piece of the puzzle.
RSI values typically range from 0 to 100. Traders often use levels of 70 and 30 as thresholds. Readings above 70 suggest the asset is overbought, indicating a potential price reversal to the downside. Conversely, readings below 30 suggest the asset is oversold, hinting at a possible upward correction.
Overbought and Oversold Levels and Their Limitations
The commonly used thresholds of 70 and 30 for overbought and oversold conditions, respectively, are not absolute rules. While these levels frequently signal potential turning points, they are not foolproof. Strong trends can sustain RSI readings above 70 or below 30 for extended periods. Relying solely on these levels without considering other factors can lead to inaccurate trading decisions and missed opportunities. It’s essential to analyze RSI in conjunction with price action, volume, and other technical indicators for a more comprehensive perspective.
Examples of False RSI Signals
It’s crucial to acknowledge that RSI signals can be misleading. Here are some scenarios where the 70 and 30 levels might provide false signals:
- Strong Uptrend: Imagine a stock experiencing a rapid and sustained uptrend. The price might continue to rise even if the RSI remains above 70 for several days or even weeks. A sell signal based solely on the overbought reading would have been premature and resulted in a missed profit opportunity. The RSI would only signal a potential reversal once the uptrend momentum weakens.
- Strong Downtrend: Similarly, during a strong downtrend, the RSI might stay below 30 for an extended time. A buy signal based on the oversold reading might be incorrect, leading to further losses as the downtrend continues. The RSI would only signal a potential reversal once the downtrend momentum weakens.
- Consolidation Phase: During periods of sideways price movement (consolidation), the RSI might fluctuate between overbought and oversold levels without any significant price changes. This whipsaw effect can generate numerous false signals, leading to frequent and potentially unprofitable trades.
RSI Divergence: How To Use RSI In Forex Trading
RSI divergence, a powerful tool for forex traders, reveals discrepancies between price action and RSI momentum. When these diverge, it often signals a potential trend reversal, offering valuable insights that can significantly enhance your trading strategy. Understanding and correctly interpreting these divergences can lead to more informed trading decisions and potentially improved profitability.
RSI divergence occurs when the price of a currency pair makes a new high or low, but the RSI fails to confirm this movement. This discrepancy suggests a weakening of the underlying momentum, hinting at a possible price reversal. Let’s explore the two main types: bullish and bearish divergence.
Bullish RSI Divergence
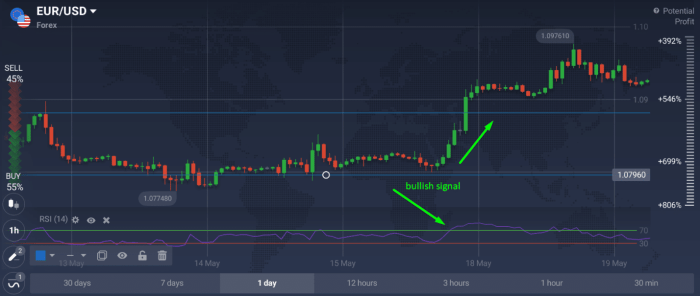
Bullish divergence occurs when the price makes a lower low, but the RSI forms a higher low. This suggests that buying pressure is increasing despite the downward price movement. Imagine a chart showing EUR/USD falling to a new low. However, the RSI, instead of hitting a new low, forms a higher low than the previous swing low. This divergence indicates that selling pressure might be waning, and a price reversal to the upside could be imminent. The higher low on the RSI suggests that the downward momentum is losing steam, and buyers are starting to step in, potentially leading to a bullish price reversal. Traders often look for confirmation before entering a long position, such as a breakout above a recent swing high or increased trading volume.
Bearish RSI Divergence
Bearish divergence is the opposite of bullish divergence. It happens when the price makes a higher high, but the RSI makes a lower high. This indicates that selling pressure is strengthening, despite the upward price movement. For instance, consider GBP/USD climbing to a new high. However, the RSI forms a lower high than the previous swing high. This suggests that the upward momentum is weakening, and sellers might be taking control, potentially leading to a price reversal downwards. The lower high on the RSI signifies that the upward momentum is slowing, and sellers might be increasing their positions, setting the stage for a potential bearish reversal. Traders might seek confirmation signals, such as a breakdown below a recent swing low or increased selling volume, before entering a short position.
Comparing RSI Divergence to Other Indicators
RSI divergence is a valuable tool, but it’s most effective when used in conjunction with other technical indicators. For example, combining RSI divergence with support and resistance levels can help confirm potential reversal points and improve the accuracy of trading signals. Similarly, integrating RSI divergence with moving averages or candlestick patterns can provide a more comprehensive picture of market dynamics, leading to more well-informed trading decisions. While RSI divergence offers valuable insights into potential reversals, it’s crucial to remember that no indicator is perfect. False signals can occur, highlighting the importance of risk management and confirmation from other technical analysis tools. Relying solely on RSI divergence for trading decisions can be risky. Therefore, a multi-faceted approach incorporating multiple indicators and careful risk management is essential for successful forex trading.
Combining RSI with Other Indicators
RSI, while a powerful momentum indicator, shines even brighter when combined with other tools. Using RSI in isolation can lead to false signals, but integrating it with other indicators significantly enhances accuracy and reduces the risk of whipsaws. This synergistic approach provides a more comprehensive market analysis, leading to more informed trading decisions.
RSI’s strength lies in identifying overbought and oversold conditions, but it doesn’t tell the whole story about price trend or momentum strength. Pairing it with indicators that highlight trend direction and confirmation signals creates a robust trading system.
Effective Indicator Combinations and Strategies, How to Use RSI in Forex Trading
Combining RSI with other indicators allows traders to filter out false signals and confirm trading entries and exits. This approach significantly reduces the risk of making impulsive trades based solely on RSI readings.
| Indicator Combination | Strategy Description |
|---|---|
| RSI + Moving Averages (e.g., 20-period and 50-period SMA) | This strategy uses moving averages to identify the overall trend. A bullish trend is confirmed when the price is above both moving averages, and RSI is above 30. A buy signal is generated when the RSI crosses above 30 while the price is above both moving averages. Conversely, a bearish trend is confirmed when the price is below both moving averages, and RSI is below 70. A sell signal is generated when the RSI crosses below 70 while the price is below both moving averages. This combination helps filter out false signals arising from short-term price fluctuations. |
| RSI + MACD | The MACD (Moving Average Convergence Divergence) indicator identifies momentum shifts and potential trend reversals. A bullish signal is generated when the RSI crosses above 30 and the MACD histogram shows a bullish crossover (the MACD line crosses above the signal line). Conversely, a bearish signal is generated when the RSI crosses below 70 and the MACD histogram shows a bearish crossover. This combination provides strong confirmation signals, reducing the likelihood of false entries. |
Hypothetical Trading Scenario
Let’s imagine EUR/USD is trading sideways. The 20-period moving average is at 1.1000, and the 50-period moving average is at 1.0980. The price is currently at 1.0990. The RSI is at 28, indicating an oversold condition. A trader using the RSI + Moving Average strategy would wait for a confirmation signal. If the price breaks above 1.1000 (crossing the 20-period MA) and the RSI moves above 30, this would generate a strong buy signal, suggesting a potential upward trend reversal. The trader would then set a stop-loss order below the recent swing low and a take-profit order based on their risk tolerance and the potential target price.
Risk Management and Position Sizing with RSI
RSI, while a powerful tool, doesn’t guarantee profits. Successful Forex trading hinges on a robust risk management strategy, especially when relying on RSI signals. Ignoring risk can quickly lead to significant losses, erasing any gains made from accurate RSI predictions. A well-defined plan is crucial to protect your capital and ensure long-term sustainability in the market.
Using RSI effectively requires a disciplined approach to risk management. Blindly following RSI signals without considering your risk tolerance is a recipe for disaster. A solid risk management plan integrates RSI signals with position sizing strategies, allowing you to capitalize on opportunities while limiting potential losses. This involves understanding your risk tolerance and defining clear entry and exit points based on RSI readings and other market conditions.
Risk Management Plan Incorporating RSI Signals
A comprehensive risk management plan should be developed before employing RSI in your trading strategy. This plan should account for both winning and losing trades. It’s not about avoiding losses altogether—it’s about controlling them and ensuring they don’t wipe out your account.
- Define your risk tolerance: Determine the maximum percentage of your trading capital you’re willing to lose on any single trade. A common recommendation is 1-2%, but this can vary based on your experience and risk appetite. For example, if your trading capital is $10,000, a 1% risk tolerance means you should only risk $100 per trade.
- Set stop-loss orders: Always use stop-loss orders to limit potential losses. These orders automatically close your position when the price reaches a predetermined level. When using RSI, consider placing your stop-loss order below a significant support level or at a level that corresponds to an RSI oversold reading, depending on your trading strategy. For instance, if you’re going long based on an RSI oversold signal, your stop-loss might be placed just below the recent low.
- Determine take-profit levels: Establish your profit targets before entering a trade. This helps you lock in profits and avoid letting winners turn into losers. For RSI-based trades, consider placing your take-profit order at a level that corresponds to an RSI overbought reading or at a significant resistance level. If you are shorting based on an RSI overbought reading, your take profit might be placed just above the recent high.
- Diversify your trades: Don’t put all your eggs in one basket. Spread your risk across multiple trades and currency pairs. This reduces the impact of a single losing trade on your overall portfolio.
- Regularly review your performance: Track your trading results and analyze your wins and losses. This helps you identify areas for improvement in your risk management strategy and adjust your approach accordingly. Maintain a detailed trading journal documenting your trades, RSI signals, and the outcome of each trade.
Determining Appropriate Position Sizes
Position sizing is crucial for managing risk. It dictates how much capital you allocate to each trade based on your risk tolerance and the potential reward.
Position size = (Risk amount / Stop loss) * Contract size
For example: Let’s say your risk tolerance is 1% of your $10,000 trading capital ($100), your stop-loss is set at 50 pips, and your contract size is 10,000 units of the base currency.
Position size = ($100 / 50 pips) * 10,000 units = 20,000 units
This calculation indicates that you should trade 20,000 units to risk $100 on this specific trade. Remember to adjust your position size based on the volatility of the market and the specific RSI signal. A stronger RSI signal might justify a slightly larger position size, but always stay within your defined risk tolerance. Always remember that this is a simplified example, and the actual position size calculation might vary depending on the broker’s specifications and the leverage used.
Practical Applications and Trading Strategies
RSI, while a powerful indicator, isn’t a crystal ball. Its effectiveness hinges on how you integrate it into your overall trading strategy and risk management plan. Understanding its nuances and limitations is crucial for successful application. Let’s explore practical examples and strategies to leverage RSI’s potential.
RSI’s versatility allows its application across various trading styles, from short-term scalping to longer-term swing trading. The key is adapting your entry and exit signals based on your chosen timeframe and risk tolerance.
RSI in Scalping Strategies
Scalping involves quick trades aiming for small profits. RSI’s speed makes it a suitable tool for identifying short-term overbought and oversold conditions. A scalper might look for RSI divergences on a 1-minute or 5-minute chart, entering trades when RSI shows a divergence from price action, indicating a potential reversal. For instance, if the price makes a higher high but the RSI makes a lower high, it suggests a weakening uptrend, signaling a potential short opportunity. Conversely, a lower low in price coupled with a higher low in RSI indicates potential for a long position. Exits are typically triggered by a small profit target or a change in RSI momentum.
RSI in Swing Trading Strategies
Swing trading focuses on capturing medium-term price swings. Here, RSI might be used on higher timeframes, such as the 4-hour or daily charts. Traders might look for RSI breakouts above 70 (indicating potential overbought conditions) for short entries or breakouts below 30 (indicating potential oversold conditions) for long entries. Swing traders often combine RSI with other indicators (like moving averages) to confirm signals and manage risk. For example, a trader might wait for an RSI breakout below 30 *and* a bullish crossover of a 20-period and 50-period moving average before entering a long position.
Step-by-Step Implementation of an RSI-Based Trading Strategy
Let’s Artikel a simple RSI-based swing trading strategy. This strategy uses RSI in conjunction with price action for confirmation.
Do not overlook the opportunity to discover more about the subject of Advanced Forex Trading Techniques for Experienced Traders.
- Choose a timeframe: Select a timeframe appropriate for your trading style (e.g., 4-hour chart for swing trading).
- Identify potential entries: Look for instances where the price is approaching a significant support or resistance level, while RSI is showing overbought (above 70) or oversold (below 30) conditions.
- Confirm with price action: Wait for a clear price action signal confirming the potential reversal (e.g., a bearish candlestick pattern near resistance for short entries, a bullish candlestick pattern near support for long entries).
- Set stop-loss order: Place a stop-loss order slightly beyond the nearest support or resistance level to limit potential losses.
- Set profit target: Determine a realistic profit target based on your risk tolerance and the potential price movement.
- Monitor and manage: Continuously monitor the trade and adjust your stop-loss or profit target as needed, based on changing market conditions.
- Exit the trade: Close the trade when your profit target is reached or your stop-loss is triggered.
Various RSI Trading Strategies
Different strategies utilize RSI in various ways, each carrying a different risk profile.
When investigating detailed guidance, check out The Top 5 Forex Trading Books You Should Read now.
| Strategy Name | Description | Risk Level |
|---|---|---|
| RSI Divergence Trading | Identifying discrepancies between RSI and price action to anticipate reversals. | Medium |
| RSI Breakout Trading | Entering trades when RSI breaks above 70 or below 30, indicating potential overbought or oversold conditions. | Medium-High |
| RSI and Moving Average Crossover | Combining RSI with moving averages to confirm entry and exit signals. | Medium |
| RSI Channel Breakout | Identifying breakouts from established RSI channels to predict price movements. | High |
Last Word
Mastering the RSI in forex trading is a journey, not a sprint. While overbought and oversold levels offer valuable insights, remember that no indicator is perfect. Combining RSI with other tools, coupled with a solid risk management plan, is key to sustainable success. So, dive in, experiment, and refine your strategy – the forex markets await!
Common Queries
Can RSI predict the future?
No, RSI is a lagging indicator; it reflects past price movements, not future ones. It helps identify potential overbought or oversold conditions, suggesting possible reversals, but it doesn’t guarantee them.
What’s the best RSI period to use?
The optimal RSI period depends on your trading style. 14-period RSI is common, but shorter periods (e.g., 9) are better suited for scalping, while longer periods might be preferable for swing trading. Experiment to find what works best for you.
How do I avoid false signals?
False signals are inevitable. Confirm RSI signals with price action, other indicators, and consider market context. Don’t solely rely on RSI readings above 70 or below 30 to trigger trades.
Is RSI suitable for all forex pairs?
While generally applicable, RSI’s effectiveness can vary across forex pairs due to differing volatility and market characteristics. Experimentation and observation are key to understanding its performance on specific pairs.


