How to Use Stochastic Oscillator in Forex Trading? Unlocking the secrets of this powerful indicator isn’t as daunting as it seems. We’re diving deep into the world of %K and %D lines, revealing how to decipher overbought and oversold signals, spot those juicy crossover opportunities, and even identify sneaky divergence patterns. Get ready to transform your forex trading game.
This guide breaks down the stochastic oscillator, step-by-step, from its core principles and calculation methods to advanced applications like identifying momentum shifts and filtering signals from other indicators. We’ll show you how to integrate it into your existing strategies, avoid common pitfalls, and ultimately, make smarter, more informed trading decisions. Prepare for a rollercoaster of insights!
Understanding the Stochastic Oscillator
The stochastic oscillator is a momentum indicator used in technical analysis to gauge the speed and strength of price movements. Unlike other indicators that focus solely on price action, the stochastic oscillator compares a specific closing price to its price range over a given period. This unique approach allows traders to identify potential overbought and oversold conditions, providing insights into potential trend reversals or continuation. It’s a valuable tool, but remember, it’s best used in conjunction with other forms of analysis.
Stochastic Oscillator Calculation
The stochastic oscillator generates two key lines: %K and %D. %K is the primary line, reflecting the current closing price’s position relative to its recent high-low range. %D is a moving average of %K, smoothing out the %K line’s volatility and providing a clearer signal.
The calculation for %K is as follows:
%K = [(Current Close – Lowest Low)/(Highest High – Lowest Low)] * 100
Where:
* Current Close is the most recent closing price.
* Lowest Low is the lowest low price within the chosen period (e.g., 14 periods).
* Highest High is the highest high price within the chosen period (e.g., 14 periods).
The %D line is typically a simple moving average of the %K line, often a 3-period simple moving average.
Stochastic Oscillator Settings, How to Use Stochastic Oscillator in Forex Trading
Different settings for the %K and %D periods create variations in the oscillator’s sensitivity and responsiveness. Common settings include:
* %K period: This dictates the lookback period for calculating the %K line. A shorter period (e.g., 5 or 14) makes the oscillator more responsive to price changes, leading to more frequent signals, but potentially more false signals. A longer period (e.g., 20 or 30) will produce smoother lines and fewer signals, potentially missing some opportunities.
* %D period: This determines the smoothing effect on the %K line. A shorter period for %D (e.g., 3) will track %K more closely, resulting in a more volatile %D line. A longer period (e.g., 5) will produce a smoother %D line, filtering out some of the noise.
For example, a common setting is a 14-period %K and a 3-period %D (14,3). This is considered a fast stochastic, generating more signals. A slower setting might be (20,5) or even (30, 3).
Fast vs. Slow Stochastic Oscillators
The speed of the stochastic oscillator is primarily determined by the %K period. Shorter periods lead to faster, more reactive oscillators, while longer periods create slower, smoother oscillators. This table summarizes the key differences:
| Feature | Fast Stochastic (e.g., 14,3) | Slow Stochastic (e.g., 20,5) |
|---|---|---|
| %K Period | Shorter (e.g., 14) | Longer (e.g., 20) |
| %D Period | Shorter (e.g., 3) | Longer (e.g., 5) |
| Sensitivity | High; more signals, potentially more false signals | Lower; fewer signals, potentially missing some opportunities |
| Responsiveness | Fast; reacts quickly to price changes | Slow; reacts more slowly to price changes |
| Smoothing | Less smoothing | More smoothing |
Interpreting Stochastic Oscillator Signals

The Stochastic Oscillator, while seemingly complex at first glance, provides clear signals when you understand how to interpret its movements. It’s all about identifying overbought and oversold conditions, understanding crossovers, and recognizing divergence patterns. These elements, used together, paint a dynamic picture of market momentum and potential price reversals. Let’s break down how to decipher these signals effectively.
Overbought and Oversold Conditions
The Stochastic Oscillator fluctuates between 0 and 100. Readings above 80 generally indicate an overbought market, suggesting that the asset has risen too quickly and a correction might be imminent. Conversely, readings below 20 suggest an oversold condition, implying that the asset has fallen sharply and a potential rebound is possible. It’s crucial to remember that these levels are not absolute guarantees of a reversal; they are probabilistic indicators. Sometimes, a market can remain overbought or oversold for extended periods, particularly in strong trends. For instance, during a strong bull market, the Stochastic Oscillator might stay above 80 for weeks, indicating sustained buying pressure.
Crossover Signals
Crossovers of the %K and %D lines provide valuable insights into potential shifts in momentum. A bullish crossover occurs when the %K line crosses above the %D line, suggesting a potential upward trend. This signal is typically stronger when it occurs in oversold territory (below 20). Conversely, a bearish crossover happens when the %K line crosses below the %D line, signaling a potential downward trend, which is more significant when it happens in overbought territory (above 80). Imagine a scenario where the EUR/USD pair is trading sideways. A bullish crossover in the oversold region could indicate the beginning of an upward trend, prompting traders to consider long positions.
Divergence Patterns
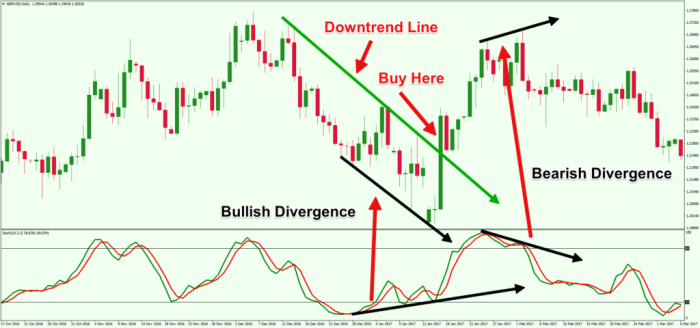
Divergence patterns highlight discrepancies between price action and the Stochastic Oscillator. Bullish divergence occurs when the price makes lower lows, but the Stochastic Oscillator forms higher lows. This suggests that buying pressure is increasing despite the price decline, potentially indicating a reversal to the upside. Bearish divergence is the opposite: the price makes higher highs, but the Stochastic Oscillator forms lower highs. This suggests weakening buying pressure and potentially foreshadows a price decline. For example, consider a stock price that creates a series of lower lows. If, simultaneously, the Stochastic Oscillator creates higher lows, this bullish divergence could suggest that the downward trend might be losing steam, potentially leading to a price bounce.
Interpreting Stochastic Oscillator Signals in Different Market Conditions
The interpretation of Stochastic Oscillator signals can vary depending on the prevailing market conditions. In ranging markets, overbought and oversold conditions can be more reliable indicators of potential reversals. However, in strong trending markets, the oscillator may remain in overbought or oversold territory for extended periods. In a sideways market, a clear crossover signal, combined with an overbought or oversold condition, could offer a more accurate prediction than relying on the crossover alone. In a trending market, divergence patterns become more important, as they can signal potential trend exhaustion or a change in momentum. Successful application of the Stochastic Oscillator requires a holistic view, combining its signals with price action, volume, and other technical indicators for confirmation.
Integrating the Stochastic Oscillator with Forex Trading Strategies
The stochastic oscillator, while powerful on its own, truly shines when combined with other technical indicators. This synergistic approach enhances signal confirmation, reduces false signals, and ultimately improves trading accuracy. By integrating it with other tools, we can create a robust trading system that leverages the strengths of multiple analytical perspectives.
A Combined Strategy: Stochastic Oscillator and Moving Averages
This strategy uses the stochastic oscillator to identify overbought and oversold conditions, while moving averages provide context regarding the overall trend. We’ll use a 20-period simple moving average (SMA) to represent the short-term trend and a 50-period SMA for the longer-term trend. The stochastic oscillator will be set to its standard 14-period setting.
A buy signal occurs when the stochastic oscillator crosses above 20 from below, and the 20-period SMA is above the 50-period SMA, indicating an uptrend. Conversely, a sell signal is generated when the stochastic oscillator crosses below 80 from above, and the 20-period SMA is below the 50-period SMA, signifying a downtrend. This combined approach filters out many false signals that might occur if relying solely on the stochastic oscillator’s overbought/oversold readings. For example, a stochastic oscillator reading above 80 during a strong uptrend might not signal an immediate reversal, and this combined strategy accounts for that.
Using the Stochastic Oscillator to Confirm Price Trends
The stochastic oscillator’s primary strength lies in its ability to confirm existing trends. While it doesn’t predict future price movements, it provides valuable confirmation of trend strength and potential reversals. For instance, in an uptrend, a stochastic oscillator reading consistently above 50, coupled with higher highs and higher lows on the price chart, strengthens the bullish outlook. Conversely, a downtrend confirmed by lower highs and lower lows is strengthened by a stochastic oscillator reading consistently below 50. Divergences between price action and the stochastic oscillator can also be crucial. A bullish divergence occurs when the price makes lower lows, but the stochastic oscillator forms higher lows. This suggests weakening bearish momentum and potential upward price movement. The opposite is true for bearish divergence.
Comparing Solo vs. Combined Indicator Use
Using the stochastic oscillator in isolation can lead to frequent false signals, especially in ranging markets. The indicator might show overbought/oversold conditions repeatedly without any significant price changes. Combining it with other indicators like moving averages, RSI, or MACD helps filter out these false signals and improve the accuracy of entry and exit points. The combination provides a more holistic view of market dynamics, reducing the risk of premature entries or exits based on isolated readings. Think of it like this: a single piece of evidence might be misleading, but multiple pieces of corroborating evidence paint a clearer picture.
A Step-by-Step Guide to Stochastic Oscillator Entry and Exit Signals
- Identify the Trend: Determine the prevailing trend using moving averages or other trend-following indicators.
- Look for Overbought/Oversold Conditions: Observe the stochastic oscillator for readings above 80 (oversold) or below 20 (overbought).
- Confirm with Trend: Only enter long positions when the stochastic oscillator is below 20 and the trend is up (confirmed by moving averages). Only enter short positions when the stochastic oscillator is above 80 and the trend is down.
- Watch for Crossovers: A bullish crossover (from below 20 to above 20) strengthens a long signal. A bearish crossover (from above 80 to below 80) strengthens a short signal.
- Set Stop-Loss and Take-Profit Orders: Always manage risk by placing stop-loss orders to limit potential losses and take-profit orders to secure profits.
- Monitor Divergences: Look for divergences between price action and the stochastic oscillator to identify potential trend reversals.
Common Mistakes and Pitfalls
The stochastic oscillator, while a powerful tool, is prone to misinterpretation and can lead to losses if not used cautiously. Understanding its limitations and common pitfalls is crucial for successful forex trading. Ignoring these aspects can result in false signals, poor risk management, and ultimately, unsuccessful trades.
Misinterpreting Oscillator Signals
The stochastic oscillator’s readings, while seemingly straightforward, can be deceptive. For instance, a reading above 80 doesn’t automatically guarantee a price reversal. Similarly, a reading below 20 doesn’t always signal an imminent price bounce. Over-reliance on these overbought and oversold levels without considering other factors, such as price action and overall market sentiment, can lead to inaccurate predictions and losses. Experienced traders often use the stochastic oscillator in conjunction with other indicators and price action analysis to confirm signals and reduce the risk of false signals. A classic example would be a strong uptrend where the stochastic oscillator remains above 80 for an extended period, despite the price continuing to rise. In such a scenario, a sell signal based solely on the oscillator’s reading would be premature and potentially costly.
Limitations in Sideways Markets
In sideways or ranging markets, the stochastic oscillator can generate numerous false signals. The constant oscillation between overbought and oversold levels can lead to whipsaws—repeated entries and exits resulting in small profits and significant transaction costs. In these situations, the stochastic oscillator is often less reliable than other indicators better suited to identifying range-bound trading opportunities, such as support and resistance levels or moving average convergence divergence (MACD). For example, if the price consolidates within a tight range, the stochastic oscillator might repeatedly cross the 80 and 20 levels, generating buy and sell signals that ultimately prove unprofitable. The trader might experience numerous small losses from these whipsaws, eroding their capital.
Avoiding False Signals
Several techniques can help minimize false signals. First, confirming signals with other indicators, such as moving averages or RSI, provides a more robust trading strategy. Second, paying close attention to price action and identifying support and resistance levels can help filter out weak signals. Third, focusing on divergence—where the price makes a new high or low, but the stochastic oscillator fails to do so—can offer high-probability trading opportunities. For instance, a bullish divergence occurs when the price makes a lower low, but the stochastic oscillator forms a higher low. This suggests a potential bullish reversal. Ignoring these confirmations and solely relying on the stochastic oscillator can result in entering trades based on false signals.
Risk Management Techniques
Effective risk management is paramount when using the stochastic oscillator. Never risk more than a small percentage of your trading capital on any single trade. Utilizing stop-loss orders to limit potential losses is crucial. Traders should also consider using trailing stop-losses to protect profits as the price moves in their favor. Furthermore, diversifying your trading strategies and avoiding over-trading are essential risk management practices. For example, risking only 1-2% of your trading capital on each trade significantly reduces the impact of losing trades. A stop-loss order placed at a key support level helps limit potential losses if the trade moves against you.
Advanced Applications of the Stochastic Oscillator
The stochastic oscillator, while seemingly simple, offers a depth of application beyond basic buy/sell signals. Mastering these advanced techniques allows traders to refine their strategies, improve signal accuracy, and ultimately, enhance profitability. This section explores some of these sophisticated uses.
Identifying Momentum Shifts
The stochastic oscillator’s primary strength lies in its ability to detect changes in momentum. A bullish divergence, where price makes a lower low but the stochastic oscillator forms a higher low, signals weakening bearish momentum and potential bullish reversal. Conversely, a bearish divergence, with price making a higher high and the stochastic oscillator forming a lower high, suggests weakening bullish momentum and a potential bearish reversal. These divergences provide early warning signs of impending trend changes, allowing traders to anticipate shifts in market sentiment before they are fully reflected in price action. For example, observing a bullish divergence during a downtrend could indicate a potential buying opportunity as the selling pressure is starting to wane.
Filtering Trading Signals from Other Indicators
The stochastic oscillator can act as a powerful filter for signals generated by other indicators. For instance, a moving average crossover might suggest a buy signal, but a simultaneously oversold stochastic oscillator reading confirms the strength of the bullish momentum and reduces the risk of a false signal. Conversely, an overbought stochastic oscillator reading can warn against entering a trade even if other indicators suggest a buy signal. This filtering process helps to improve the overall accuracy and reliability of trading decisions by reducing the likelihood of acting on unreliable signals. This approach requires a careful understanding of both the primary indicator and the stochastic oscillator’s behavior.
Application Across Different Timeframes
The effectiveness of the stochastic oscillator can vary depending on the timeframe used. On shorter timeframes (e.g., 5-minute, 15-minute charts), the oscillator can be highly volatile, generating numerous signals, some of which may be false. However, this volatility can be advantageous for scalpers and day traders seeking quick profits. Longer timeframes (e.g., daily, weekly charts), on the other hand, provide a smoother oscillator reading, generating fewer, but potentially more reliable, signals, suitable for swing traders and position traders. The choice of timeframe should always align with the trader’s preferred trading style and risk tolerance.
Stochastic Oscillator Applications Across Trading Styles
| Trading Style | Timeframe | Stochastic Oscillator Application | Typical Signals |
|---|---|---|---|
| Scalping | 1-minute, 5-minute | Identifying quick momentum shifts for very short-term trades. | Oversold/overbought readings, rapid changes in oscillator direction. |
| Day Trading | 15-minute, 30-minute, hourly | Confirming entries and exits based on price action and other indicators. | Divergences, overbought/oversold conditions in conjunction with price action. |
| Swing Trading | Daily, 4-hour | Identifying potential trend reversals and momentum shifts within a longer-term trend. | Divergences, significant overbought/oversold conditions. |
| Position Trading | Weekly, monthly | Confirming major trend changes and identifying potential long-term entry/exit points. | Strong divergences, extreme overbought/oversold conditions. |
Visual Representation of Stochastic Oscillator Signals
The stochastic oscillator, a momentum indicator, doesn’t just provide numerical values; its visual representation on a chart is crucial for interpreting its signals. Understanding these visual cues allows traders to anticipate potential price movements and adjust their strategies accordingly. The interplay between the %K and %D lines, along with their relationship to the overbought/oversold levels and price action, paints a dynamic picture of market momentum.
Overbought and Oversold Conditions
An overbought condition typically occurs when the %K line rises above 80, suggesting the asset is potentially overvalued and a price correction might be imminent. Conversely, an oversold condition is indicated when the %K line falls below 20, suggesting the asset is potentially undervalued and a price bounce could be on the horizon. However, it’s crucial to remember that these levels are not absolute; extended periods above 80 or below 20 can occur, particularly in strong trending markets. The visual appearance often involves the %K line forming a peak near or above 80, followed by a potential retracement. Similarly, an oversold condition visually appears as a trough near or below 20, potentially followed by a rebound. The context of the broader market trend should always be considered. For example, a stock in a strong uptrend might stay overbought for an extended period before a correction.
Bullish Crossover
A bullish crossover happens when the faster-moving %K line crosses above the slower-moving %D line. This is considered a bullish signal, suggesting a potential increase in buying pressure. Visually, this appears as the %K line breaking above the %D line from below. The significance of this crossover is amplified when it occurs in oversold territory (below 20), suggesting a strong potential for a price reversal. For instance, if the %K line is below 20 and then crosses above the %D line, this could signal a strong buy signal, indicating a potential price increase. The subsequent price action should confirm this signal; a noticeable upward movement in the price chart following the crossover strengthens the bullish interpretation.
Bearish Divergence
Bearish divergence occurs when the price of an asset makes a higher high, but the stochastic oscillator forms a lower high. This discrepancy between price and momentum suggests weakening bullish momentum and a potential price reversal. Visually, you’ll see the price chart creating a higher peak, while the %K and %D lines create a lower peak. This divergence acts as a warning sign, indicating that the upward price movement might be losing steam. The severity of the bearish divergence depends on the extent of the discrepancy between the price and oscillator peaks. A significant divergence often precedes a price correction or a downtrend. For example, if the price of a currency pair makes a new high but the stochastic oscillator fails to make a new high, indicating a potential reversal and a possible sell opportunity.
Stochastic Oscillator Signal Suggesting a Potential Trend Reversal
A stochastic oscillator signal suggesting a potential trend reversal often involves a combination of factors. For example, a bearish crossover in overbought territory (above 80) could indicate a potential top and the beginning of a downtrend. Conversely, a bullish crossover in oversold territory (below 20) could signal a potential bottom and the start of an uptrend. These signals are strengthened by other confirming factors, such as price action patterns (like head and shoulders or double tops/bottoms) or volume changes. A significant divergence, as previously discussed, also plays a crucial role in identifying potential trend reversals. The combination of these factors paints a clearer picture, enhancing the reliability of the reversal signal.
Conclusion: How To Use Stochastic Oscillator In Forex Trading
Mastering the stochastic oscillator is a game-changer for forex traders. By understanding its signals, integrating it with other indicators, and avoiding common traps, you’ll gain a significant edge. Remember, consistent practice and risk management are key. So, equip yourself with this knowledge, refine your strategy, and prepare to navigate the forex markets with newfound confidence. The journey to profitable trading starts now!
FAQ Insights
Can I use the stochastic oscillator on all currency pairs?
While it can be applied to most pairs, its effectiveness might vary depending on market volatility and trends. Some pairs might exhibit more reliable signals than others.
What timeframe is best for the stochastic oscillator?
The optimal timeframe depends on your trading style. Shorter timeframes (e.g., 5-minute, 15-minute) are suitable for scalping or day trading, while longer timeframes (e.g., daily, weekly) are better for swing trading.
How do I manage risk when using the stochastic oscillator?
Never rely solely on the stochastic oscillator. Always combine it with other indicators and implement proper risk management techniques, including stop-loss orders and position sizing, to protect your capital.
Is the stochastic oscillator always accurate?
No indicator is perfect. The stochastic oscillator can generate false signals, especially in ranging markets. Always confirm signals with price action and other indicators.
Do not overlook the opportunity to discover more about the subject of The Impact of Economic Indicators on Forex Trading.
Do not overlook explore the latest data about How to Become a Profitable Forex Trader in 2025.
