How to Use Bollinger Bands in Forex? Unlocking the secrets of this powerful technical indicator isn’t as daunting as it seems. Bollinger Bands, with their visually striking bands flanking a moving average, offer a dynamic way to gauge market volatility and spot potential trading opportunities in the forex market. This guide will break down the basics, from understanding the components to crafting effective trading strategies using Bollinger Bands, ensuring you’re equipped to navigate the exciting world of forex trading with confidence.
We’ll explore how to interpret the signals generated by these bands, covering everything from price bounces to bandwidth expansions and contractions. We’ll also show you how to combine Bollinger Bands with other indicators, like RSI or MACD, to refine your analysis and minimize risk. Get ready to dive into practical applications, learn about risk management, and even uncover advanced techniques to optimize your Bollinger Band strategies for various market conditions and trading styles.
Introduction to Bollinger Bands in Forex
Bollinger Bands are a technical analysis tool used by forex traders to gauge price volatility and potential reversals. They’re essentially dynamic bands that wrap around a moving average of a security’s price, providing a visual representation of price action relative to its recent average. This helps traders identify overbought and oversold conditions, potential breakouts, and periods of high and low volatility. Understanding how Bollinger Bands work can significantly improve your trading strategy, adding another layer of insight to your market analysis.
Bollinger Bands are composed of three lines: a simple moving average (SMA), and two standard deviation bands positioned above and below the SMA. The SMA acts as the central tendency line, representing the average price over a specific period. The standard deviation bands, calculated from the SMA, measure price volatility. Wider bands indicate higher volatility, suggesting potentially larger price swings, while narrower bands suggest lower volatility and potentially smaller price movements. These bands dynamically adjust to the price’s volatility; as volatility increases, the bands widen, and as volatility decreases, they narrow.
Bollinger Band Components
The three core components of Bollinger Bands are intricately linked to provide a comprehensive view of price behavior. The simple moving average (SMA) is usually a 20-period average, but other periods can be used depending on the trader’s preference and the timeframe being analyzed. This SMA forms the central line around which the bands fluctuate. The standard deviation calculation measures the dispersion of prices around this SMA. Two standard deviations above and below the SMA create the upper and lower bands. The distance between the upper and lower bands represents the overall volatility of the asset. A wider distance indicates higher volatility, and a narrower distance indicates lower volatility.
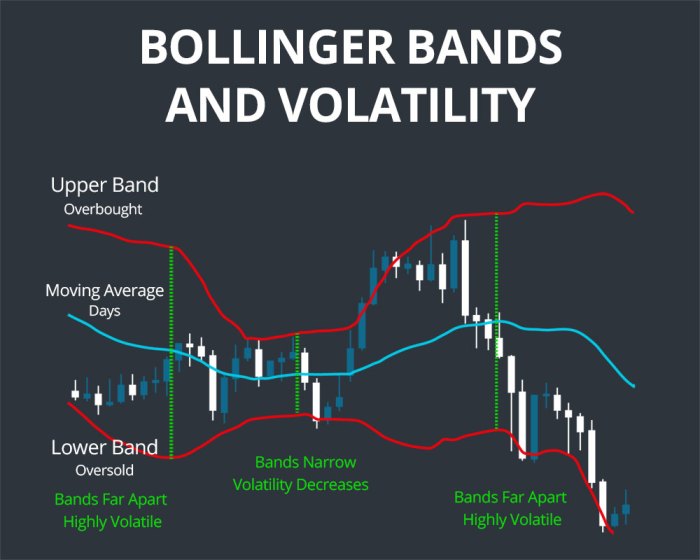
Visual Representation of Bollinger Bands
Imagine a forex chart displaying the price of EUR/USD. Overlaid on the price chart are three lines: a central moving average line (often a 20-period SMA), an upper band, and a lower band. The price action fluctuates within these bands, sometimes touching or even breaking through them. When the price approaches the upper band, it might signal an overbought condition, suggesting a potential price reversal to the downside. Conversely, when the price approaches the lower band, it could suggest an oversold condition, potentially indicating a price reversal to the upside. Breakouts beyond these bands can also signify strong directional momentum. Note that while these are common interpretations, they aren’t guaranteed signals and should be used in conjunction with other forms of technical analysis.
Example Bollinger Band Data
The following table illustrates example data points, demonstrating how Bollinger Bands might appear on a chart. Note that these are illustrative values and real-world data will vary considerably. The “Band Width” column is simply the difference between the upper and lower bands.
| Date | Open Price (EUR/USD) | Close Price (EUR/USD) | Band Width |
|---|---|---|---|
| 2024-03-04 | 1.0850 | 1.0875 | 0.0150 |
| 2024-03-05 | 1.0870 | 1.0900 | 0.0175 |
| 2024-03-06 | 1.0910 | 1.0880 | 0.0125 |
| 2024-03-07 | 1.0875 | 1.0920 | 0.0160 |
Interpreting Bollinger Band Signals
Bollinger Bands, at their core, aren’t crystal balls predicting the future. Instead, they’re a dynamic tool revealing market volatility and potential price reversal points. By understanding how price interacts with the bands and how the bands themselves behave, you can glean valuable insights for your forex trading strategy. Let’s dive into deciphering those signals.
Price touching the upper or lower bands often suggests an overbought or oversold condition, respectively. This doesn’t automatically mean a guaranteed reversal, but it highlights a potential turning point. Think of it like a rubber band stretched to its limit – it’s likely to snap back eventually. However, remember, the market can remain overbought or oversold for extended periods, especially in trending markets.
Band Width Expansion and Contraction
The distance between the upper and lower Bollinger Bands directly reflects market volatility. Wide bands indicate high volatility, suggesting larger price swings and potentially more significant trading opportunities. Conversely, narrow bands signal low volatility, implying smaller price movements and potentially fewer opportunities, though potentially higher accuracy when a breakout occurs. Imagine a tightly wound spring – the potential energy is there, but it needs a trigger to release. Similarly, narrow bands often precede significant price breakouts.
False Signals and Limitations
Bollinger Bands, like any indicator, aren’t perfect. False signals can occur, particularly in strong trending markets. For example, in a strong uptrend, the price might stay above the upper band for an extended time, giving a false sense of an overbought condition. Conversely, in a downtrend, the price might remain below the lower band, falsely suggesting an oversold market. It’s crucial to use Bollinger Bands in conjunction with other technical indicators and fundamental analysis to confirm potential signals and reduce the risk of false signals. Relying solely on Bollinger Bands can be a recipe for disaster. Consider a scenario where the USD/JPY is experiencing a strong bullish trend. The price consistently stays above the upper Bollinger Band. While the indicator suggests an overbought condition, the underlying trend suggests further upside potential. A trader solely relying on the Bollinger Band signal might prematurely sell, missing out on potential profits.
Bollinger Bands and Other Indicators
Bollinger Bands, while powerful on their own, become even more effective when used in conjunction with other technical indicators. Combining them allows for a more nuanced understanding of market momentum and potential reversals, leading to more informed trading decisions. This section explores how Bollinger Bands synergize with other popular tools and how this combined approach can enhance your forex trading strategy.
Bollinger Bands Compared with RSI and MACD
Understanding the strengths and weaknesses of combining Bollinger Bands with other indicators like the Relative Strength Index (RSI) and the Moving Average Convergence Divergence (MACD) is crucial for effective trading. Each indicator provides a unique perspective on price action and momentum.
- Bollinger Bands + RSI: Bollinger Bands identify price volatility and potential overbought/oversold conditions based on standard deviation, while the RSI measures the speed and change of price movements. Combining them can offer a powerful confirmation signal. For instance, a price approaching the upper Bollinger Band coupled with an RSI above 70 (oversold) suggests a potential price reversal. Conversely, a price near the lower band with an RSI below 30 (oversold) could indicate a buying opportunity. The weakness of this combination lies in the possibility of false signals, especially in ranging markets where the RSI may remain in overbought/oversold territory for extended periods.
- Bollinger Bands + MACD: Bollinger Bands show price volatility and potential breakouts, while the MACD highlights momentum shifts through the convergence and divergence of moving averages. A bullish MACD crossover occurring while the price is bouncing off the lower Bollinger Band can be a strong buy signal. Similarly, a bearish crossover near the upper band might signal a sell opportunity. The weakness here lies in the potential for lagging signals; the MACD can sometimes be slow to react to sudden price changes.
Bollinger Bands and Support/Resistance Levels
Support and resistance levels represent significant price points where buying or selling pressure is expected to be strong. Integrating these levels with Bollinger Bands enhances trade setups by providing confirmation of potential breakouts or reversals.
For example, imagine a price approaching a key resistance level. If the price also reaches the upper Bollinger Band, and then experiences a rejection, it strengthens the likelihood of a price reversal. Conversely, a price approaching a support level that simultaneously touches the lower Bollinger Band and then bounces, suggests a potential upward trend. This combined approach minimizes the risk of entering trades based solely on one indicator and increases the probability of successful trades. A breakout above the resistance level coupled with a break above the upper Bollinger Band signifies a strong bullish signal, while a breakdown below the support level and the lower Bollinger Band suggests a strong bearish signal.
A Trading Strategy Using Bollinger Bands and the RSI
This strategy combines the volatility insights of Bollinger Bands with the momentum insights of the RSI.
Entry Rules:
* Long Entry: A price bounce off the lower Bollinger Band with an RSI below 30 suggests a potential long position. Confirm the signal with bullish candlestick patterns (e.g., hammer, bullish engulfing).
* Short Entry: A price bounce off the upper Bollinger Band with an RSI above 70 suggests a potential short position. Confirm the signal with bearish candlestick patterns (e.g., hanging man, bearish engulfing).
Exit Rules:
* Long Exit: Exit the long position when the price breaks below the middle Bollinger Band or the RSI crosses above 70.
* Short Exit: Exit the short position when the price breaks above the middle Bollinger Band or the RSI crosses below 30.
This strategy emphasizes confirmation from both indicators, reducing the risk of false signals. Remember to always use proper risk management techniques, such as setting stop-loss and take-profit orders, to protect your capital. This strategy should be tested and refined using historical data and a demo account before being applied to live trading.
Practical Applications of Bollinger Bands in Forex Trading
Bollinger Bands, while seemingly simple, offer a surprisingly versatile toolkit for Forex traders of all stripes. Understanding how to interpret their signals is only half the battle; effectively applying them to your trading strategy requires a nuanced approach, encompassing both opportunity identification and robust risk management. This section delves into practical applications, demonstrating how to leverage Bollinger Bands for profitable trading.
Identifying Buy and Sell Opportunities Using Bollinger Bands
The core principle revolves around price action relative to the bands. Price bouncing off the lower band often signals potential buying opportunities, while a touch of the upper band suggests potential selling points. However, this is not a foolproof system; confirmation from other indicators or price patterns is crucial. Let’s break down a step-by-step approach:
- Identify the Trend: Before anything else, determine the overall trend (uptrend, downtrend, or sideways). Bollinger Bands work best within the context of an established trend. A strong uptrend, for instance, might see price consistently touching the upper band, while a downtrend sees frequent touches of the lower band. Ignoring the broader trend can lead to false signals.
- Look for Bounce Points: In an uptrend, a price dip to the lower band, followed by a bounce, suggests a potential buying opportunity. Conversely, in a downtrend, a price surge to the upper band, followed by a reversal, signals a potential selling opportunity. The strength of the bounce (measured by candlestick patterns and volume) further validates the signal.
- Consider Band Width: Narrow bands suggest low volatility, potentially signaling a breakout is imminent. A breakout above the upper band in a narrow band context can be a strong buy signal, and a breakout below the lower band a strong sell signal. Conversely, wide bands indicate high volatility, making accurate predictions more challenging.
- Confirm with Other Indicators: Relying solely on Bollinger Bands is risky. Confirm your signals using other technical indicators like RSI (Relative Strength Index) or MACD (Moving Average Convergence Divergence). For example, a bounce off the lower band coupled with an RSI reading below 30 strengthens the buy signal.
- Observe Price Action: Pay close attention to candlestick patterns at the bounce points. A bullish candlestick (like a hammer or engulfing pattern) at the lower band reinforces a buy signal, while a bearish candlestick (like a shooting star or hanging man) at the upper band reinforces a sell signal.
Risk Management Techniques When Using Bollinger Bands
Effective risk management is paramount. Even the most accurate indicators can produce losing trades. Here’s how to mitigate risk:
- Use Stop-Loss Orders: Always place a stop-loss order to limit potential losses. A common strategy is to place the stop-loss just below the lower band for long positions and just above the upper band for short positions.
- Define Take-Profit Levels: Set realistic take-profit targets. These could be based on a specific percentage gain, a price level, or a combination of both. Avoid chasing profits; lock in gains when your target is reached.
- Position Sizing: Never risk more than a small percentage of your trading capital on any single trade. This helps to protect your account balance from significant drawdowns.
- Diversify Your Portfolio: Don’t put all your eggs in one basket. Spread your trades across different currency pairs to reduce the impact of any single losing trade.
Bollinger Bands and Different Trading Styles, How to Use Bollinger Bands in Forex
Bollinger Bands adapt to various trading styles:
Scalping: Scalpers use Bollinger Bands to identify very short-term price movements. They look for quick bounces off the bands, aiming for small profits within minutes or hours. The high frequency of trades requires tight stop-losses and excellent discipline.
Check what professionals state about Swing Trading Strategies for Forex and its benefits for the industry.
Day Trading: Day traders employ Bollinger Bands to identify intraday trading opportunities. They might look for price breakouts from the bands or reversals at the band boundaries, aiming for profits within a single trading day. Risk management is critical due to the higher volatility.
Further details about The Most Important Forex Trading Indicators You Should Know is accessible to provide you additional insights.
Swing Trading: Swing traders use Bollinger Bands to identify longer-term price swings, holding positions for several days or weeks. They might look for price pullbacks to the lower band within an uptrend, or pullbacks to the upper band within a downtrend, aiming for larger profit targets. Patience and discipline are key.
Advanced Bollinger Band Techniques
Mastering Bollinger Bands goes beyond simply identifying breakouts. This section delves into more sophisticated techniques that can significantly enhance your trading strategies and refine your market analysis. By understanding and applying these advanced concepts, you can improve your risk management and potentially increase your profitability.
Bollinger Band Squeeze and its Implications for Trading. A Bollinger Band squeeze occurs when the bands contract, indicating a period of low volatility. This compression often precedes a significant price move, either up or down, as pent-up energy is released. Traders often use this as a signal to prepare for increased market activity. However, it’s crucial to remember that a squeeze doesn’t predict the direction of the price movement; it only suggests that a significant move is likely.
Bollinger Band Squeeze Interpretation
A squeeze is visually identified by the narrowing of the bands. The closer the price action gets to the middle band, and the closer the upper and lower bands are to each other, the stronger the squeeze. Confirmation often comes from other indicators or price action patterns. For example, a bullish engulfing candlestick pattern forming during a squeeze could suggest a strong upward breakout is imminent. Conversely, a bearish engulfing pattern could suggest a downward breakout. It’s vital to avoid jumping to conclusions based solely on the squeeze; always corroborate with additional analysis. Successful traders often combine Bollinger Band squeezes with other technical indicators, such as RSI or MACD, to increase the accuracy of their predictions. For instance, a bullish squeeze coupled with an RSI nearing oversold levels would significantly strengthen the bullish signal.
Adjusting Bollinger Band Settings
The standard Bollinger Band settings are a 20-period moving average with two standard deviations. However, adjusting these parameters can optimize performance depending on market conditions. Using a shorter period, such as 10, might be more suitable for fast-moving, volatile markets, providing quicker signals. Conversely, a longer period, such as 50, could be more appropriate for slower, trend-following markets, filtering out short-term noise. Similarly, adjusting the standard deviation can affect the sensitivity. Increasing the standard deviation widens the bands, making them less sensitive to price fluctuations and suitable for ranging markets. Decreasing the standard deviation narrows the bands, making them more sensitive and ideal for volatile markets. Experimentation is key to finding the optimal settings for different assets and timeframes. For example, a highly volatile currency pair like GBP/JPY might benefit from a shorter period and lower standard deviation, while a less volatile pair like EUR/USD might perform better with a longer period and higher standard deviation.
Bollinger Bands Across Different Currency Pairs and Timeframes
The effectiveness of Bollinger Bands can vary across different currency pairs and timeframes. Highly volatile pairs, like those involving emerging market currencies, might produce more frequent signals, requiring more careful interpretation to avoid false breakouts. Conversely, less volatile pairs might offer fewer opportunities but potentially more reliable signals. Similarly, the timeframe significantly impacts the results. Using Bollinger Bands on a 1-minute chart will produce numerous signals, many of which will be noise. On a daily chart, the signals will be far fewer but potentially more significant. Experienced traders often employ Bollinger Bands across multiple timeframes to confirm signals and identify higher-probability trading opportunities. For example, a bullish breakout confirmed on both the 4-hour and daily charts would significantly increase the confidence in the trade. Conversely, a contradictory signal across timeframes would suggest caution.
Limitations of Bollinger Bands: How To Use Bollinger Bands In Forex
Bollinger Bands, while a powerful tool, aren’t a magic bullet for Forex trading success. Like any indicator, they have limitations and relying solely on them can lead to significant losses. Understanding these limitations is crucial for responsible and profitable trading. This section will explore the scenarios where Bollinger Bands might fall short and offer strategies to mitigate the associated risks.
Bollinger Bands are based on statistical calculations of price volatility. Their effectiveness hinges on the assumption that price movements will, to some degree, revert to the mean. However, in volatile or trending markets, this assumption can break down, leading to inaccurate signals and potentially costly trading decisions. For instance, during a strong and prolonged uptrend, prices might remain consistently above the upper band, rendering the “oversold” signal generated by the lower band essentially useless. Conversely, in a sharp downtrend, prices might stay below the lower band, making the “overbought” signal generated by the upper band unreliable.
False Signals in Trending Markets
Strong trends can easily invalidate Bollinger Band signals. The bands widen during periods of high volatility, but this widening doesn’t necessarily predict a price reversal. In a strong uptrend, prices can continue to rise, staying above the upper band for extended periods, leading traders to incorrectly anticipate a reversal. Similarly, in a strong downtrend, prices can stay below the lower band, causing traders to miss potential buying opportunities based on a false “oversold” signal. Successful traders using Bollinger Bands need to consider the overall market context and trend direction, not just the band positions. Confirmation from other indicators or price action analysis is vital to avoid acting on misleading signals.
Lagging Indicator Nature
Bollinger Bands are a lagging indicator; they react to price movements rather than predicting them. This means the signals generated often appear after a significant price change has already occurred. By the time the bands suggest a potential reversal, the most profitable entry point may have already passed. This lag can be particularly problematic in fast-moving markets where quick decision-making is crucial. To mitigate this, traders should combine Bollinger Bands with leading indicators or focus on confirming signals through other technical analysis methods like candlestick patterns or support/resistance levels.
Inability to Predict Market Volatility Shifts
The width of the Bollinger Bands reflects market volatility. However, the bands themselves don’t predict changes in volatility. A sudden increase or decrease in volatility can render the bands’ signals less reliable. For example, an unexpected news event can drastically increase volatility, causing prices to break out of the bands without warning. This unexpected volatility shift can lead to significant losses if traders rely solely on the Bollinger Bands for risk management. Therefore, traders must stay informed about macroeconomic events and geopolitical factors that could influence market volatility.
Over-reliance and Confirmation Bias
Focusing solely on Bollinger Bands can lead to confirmation bias, where traders only look for signals that confirm their existing biases. This can result in ignoring other important market information or potentially profitable opportunities. A diversified approach, incorporating multiple indicators and careful risk management, helps mitigate this bias and improve overall trading performance. It is essential to develop a robust trading plan that incorporates multiple strategies and risk management protocols, not solely relying on one indicator.
Wrap-Up
Mastering Bollinger Bands in forex trading isn’t about memorizing formulas; it’s about understanding market behavior and using this tool to enhance your decision-making. By combining a solid grasp of the fundamentals with practical application and risk management, you can leverage the power of Bollinger Bands to identify high-probability trading setups and boost your trading performance. Remember, while Bollinger Bands are a valuable tool, they’re not a crystal ball. Always combine them with other forms of analysis and maintain a disciplined approach to risk management for sustainable success in the forex market.
FAQ Guide
What are the common mistakes traders make when using Bollinger Bands?
Over-reliance on Bollinger Bands as the sole trading signal, ignoring other forms of analysis, and failing to adjust settings based on market volatility are common pitfalls.
Can I use Bollinger Bands for all currency pairs?
Yes, but optimal settings might need adjustments depending on the volatility of each pair. Highly volatile pairs may require wider bands or different periods.
How do I choose the right period for my Bollinger Bands?
The period depends on your trading style. Shorter periods (e.g., 10-20) suit scalpers, while longer periods (e.g., 50-200) are better for swing traders.
What are some alternative indicators that work well with Bollinger Bands?
RSI, MACD, and moving averages are frequently used in conjunction with Bollinger Bands to confirm signals and filter noise.


