How to Use Moving Average Convergence Divergence (MACD) in Forex: Unlocking the secrets of this powerful indicator isn’t as daunting as it sounds. This guide breaks down the MACD – its components (MACD line, signal line, histogram), calculation, and interpretation – making it accessible even for beginners. We’ll explore how to spot buy and sell signals, identify divergences, and understand histogram patterns. Prepare to level up your forex trading game!
We’ll delve into advanced techniques, showing you how to combine MACD with other indicators like RSI and moving averages for enhanced accuracy and risk management. We’ll also dissect potential pitfalls and false signals, equipping you with the knowledge to avoid common mistakes. Through real-world examples and hypothetical scenarios, you’ll gain practical experience applying MACD to real trading situations, ultimately boosting your confidence and profitability.
Introduction to MACD in Forex Trading
The Moving Average Convergence Divergence (MACD) indicator is a powerful tool used by forex traders to identify potential buy and sell signals. It’s a momentum indicator that helps gauge the strength and direction of price trends, making it a valuable addition to any trader’s arsenal. Unlike some indicators that can be easily misinterpreted, the MACD provides a relatively clear visual representation of market sentiment, aiding in informed decision-making. Understanding its components and how to interpret them is key to successfully utilizing this indicator.
MACD Indicator Components
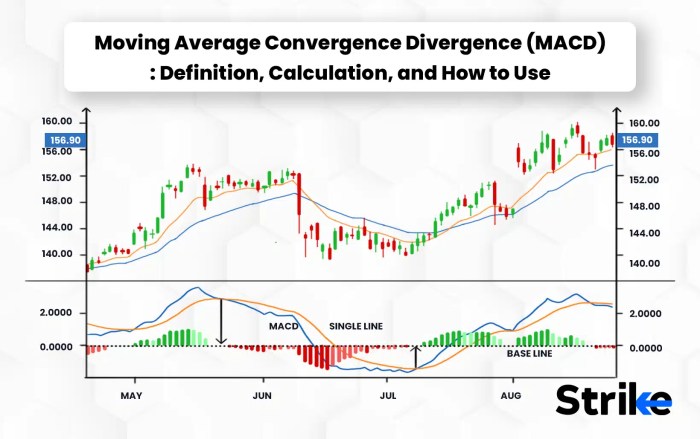
The MACD indicator is composed of three key elements: the MACD line, the signal line, and the histogram. These three work together to provide a comprehensive picture of market momentum. The MACD line itself represents the difference between two exponential moving averages (EMAs) of the price. The signal line is a further EMA of the MACD line, acting as a smoother and providing a clearer indication of trend changes. Finally, the histogram visually represents the difference between the MACD line and the signal line, providing a readily interpretable visual of the momentum.
MACD Calculation and Parameters
The MACD is calculated by subtracting a slower-moving EMA from a faster-moving EMA of the price. Standard parameters typically use a 12-period EMA for the fast EMA and a 26-period EMA for the slow EMA. The resulting value is the MACD line. A 9-period EMA of the MACD line is then calculated to generate the signal line. The histogram simply plots the difference between the MACD line and the signal line. Different parameter settings can be experimented with, but the standard settings provide a good starting point. The formula for the MACD is:
MACD = 12-period EMA – 26-period EMA
Visual Representation of a MACD Chart
The following table illustrates a sample week’s worth of data points for a hypothetical currency pair, showing the price, MACD line, signal line, and histogram values. Remember, this is a simplified example and actual market data will fluctuate much more dynamically.
| Price | MACD Line | Signal Line | Histogram |
|---|---|---|---|
| 1.1200 | 0.010 | 0.005 | 0.005 |
| 1.1220 | 0.015 | 0.007 | 0.008 |
| 1.1210 | 0.012 | 0.009 | 0.003 |
| 1.1180 | 0.008 | 0.009 | -0.001 |
| 1.1150 | 0.003 | 0.008 | -0.005 |
| 1.1170 | 0.005 | 0.007 | -0.002 |
| 1.1200 | 0.008 | 0.006 | 0.002 |
Identifying MACD Signals for Buy and Sell Opportunities
The Moving Average Convergence Divergence (MACD) indicator isn’t just a pretty graph; it’s a powerful tool for spotting potential buy and sell opportunities in the forex market. By understanding how to interpret its signals – divergences, crossovers, and histogram patterns – you can significantly improve your trading decisions. Let’s dive into the specifics.
Bullish and Bearish Divergences
Divergences occur when the price action of a currency pair and the MACD indicator move in opposite directions. These divergences can signal a potential reversal in the prevailing trend. Identifying them requires a keen eye and understanding of both price and indicator behavior.
- Bearish Divergence: Imagine the price of EUR/USD makes a series of higher highs, but the MACD makes lower highs. This indicates weakening bullish momentum and suggests a potential price reversal to the downside. The price might be topping out while the MACD shows declining buying pressure.
- Bullish Divergence: Conversely, a bullish divergence occurs when the price makes a series of lower lows, but the MACD forms higher lows. This suggests that selling pressure is weakening, potentially signaling a price bounce or a trend reversal to the upside. Buyers may be stepping in despite the lower price action.
MACD Line and Signal Line Crossovers
The MACD indicator consists of two lines: the MACD line and the signal line. Crossovers between these lines generate buy or sell signals.
| Bullish Crossover | Bearish Crossover |
|---|---|
| The MACD line crosses above the signal line. This suggests a shift from bearish to bullish momentum and is considered a buy signal. It indicates that the shorter-term moving average is outpacing the longer-term moving average, implying a strengthening uptrend. | The MACD line crosses below the signal line. This signals a shift from bullish to bearish momentum and is considered a sell signal. It indicates that the shorter-term moving average is falling behind the longer-term moving average, implying a weakening uptrend or a strengthening downtrend. |
Histogram Patterns, How to Use Moving Average Convergence Divergence (MACD) in Forex
The MACD histogram visually represents the difference between the MACD line and the signal line. The length and direction of the bars within the histogram provide additional insights into momentum.
- Increasing Bars (Bullish): Longer and taller bars indicate increasing bullish momentum. This strengthens a buy signal, suggesting a strong uptrend is likely to continue.
- Decreasing Bars (Bearish): Shrinking bars suggest waning bullish momentum or the beginning of bearish momentum. This weakens a buy signal or could even foreshadow a sell signal.
- Histogram Divergence: Similar to price divergences, histogram divergences can also provide valuable insights. For example, increasing price highs with decreasing histogram bars could indicate weakening momentum and a potential price reversal.
MACD in Conjunction with Other Indicators
The MACD, while powerful on its own, becomes even more potent when combined with other indicators or price action analysis. This synergistic approach helps filter false signals and confirms trading opportunities, significantly improving trading accuracy and risk management. Let’s explore how to leverage this multifaceted approach.
MACD Combined with Other Indicators: A Comparative Analysis
Understanding the strengths and weaknesses of various indicators is crucial for effective combination. Using MACD in isolation can lead to whipsaws, especially in choppy markets. Pairing it with other indicators helps mitigate this risk. The following table compares MACD with two other popular Forex indicators: the Relative Strength Index (RSI) and simple moving averages (SMA).
| Indicator | Effectiveness | Situations for Combined Use with MACD |
|---|---|---|
| RSI | Measures momentum and identifies overbought/oversold conditions. Effective in identifying potential trend reversals. | Use with MACD to confirm trend reversals. A bearish divergence on MACD coupled with RSI approaching overbought levels strengthens a potential short signal. Conversely, bullish divergence on MACD with RSI near oversold levels can signal a potential long opportunity. |
| SMA | Provides a visual representation of price trends and support/resistance levels. | Combine with MACD to identify trend confirmation. A bullish MACD crossover above the signal line, coupled with the price breaking above a key SMA, provides a strong buy signal. The opposite scenario signals a potential sell opportunity. |
MACD and Price Action Confirmation
Price action analysis provides crucial context for interpreting MACD signals. Combining these two approaches significantly reduces false signals and enhances trading accuracy. Consider this step-by-step process:
1. Identify a potential MACD signal: Look for a bullish crossover (MACD line crossing above the signal line) or a bearish crossover (MACD line crossing below the signal line).
2. Analyze price action: Observe the candlestick patterns around the potential MACD signal. A bullish crossover confirmed by a bullish candlestick pattern (like a hammer or bullish engulfing) strengthens the buy signal. Similarly, a bearish crossover confirmed by a bearish candlestick pattern (like a hanging man or bearish engulfing) reinforces a sell signal.
3. Look for confirmation from support/resistance levels: If the MACD signal aligns with a price bounce off a support level (for buy signals) or a breakdown from a resistance level (for sell signals), it significantly increases the probability of a successful trade.
4. Evaluate volume: Higher volume accompanying the price action and MACD signal adds further confirmation. Weak volume can indicate a lack of conviction and might suggest a false signal.
For example, a bullish MACD crossover accompanied by a bullish engulfing candlestick pattern at a key support level with increasing volume would provide a strong confirmation for a long position.
Hypothetical Trading Strategy: MACD and RSI
This strategy uses the MACD and RSI to identify high-probability trading opportunities.
Entry Rules:
* Long Entry: A bullish MACD crossover above the signal line AND RSI below 30 (oversold condition). The price should ideally be near a support level.
* Short Entry: A bearish MACD crossover below the signal line AND RSI above 70 (overbought condition). The price should ideally be near a resistance level.
Exit Rules:
* Long Exit: A bearish MACD crossover below the signal line OR RSI above 70. Alternatively, a predetermined stop-loss order can be placed below the entry price.
* Short Exit: A bullish MACD crossover above the signal line OR RSI below 30. Alternatively, a predetermined stop-loss order can be placed above the entry price.
This strategy uses the MACD to identify the trend and the RSI to filter out false signals and identify potential reversals. The combination of these two indicators provides a more robust and reliable trading system, reducing the risk of entering losing trades. Remember that risk management, including proper stop-loss and take-profit levels, is crucial for any trading strategy.
Understanding Limitations and Risks of Using MACD

The Moving Average Convergence Divergence (MACD) indicator, while a powerful tool, isn’t a crystal ball. Relying solely on it for Forex trading decisions can lead to significant losses if you don’t understand its limitations and potential pitfalls. Successful traders use MACD in conjunction with other indicators and robust risk management strategies. Let’s delve into the potential downsides.
Let’s explore some key limitations of the MACD indicator and how to navigate them effectively.
Obtain access to ChatGPT to private resources that are additional.
MACD Limitations and Pitfalls
Several factors can significantly impact the accuracy and reliability of MACD signals. Over-reliance on this single indicator can lead to misinterpretations and ultimately, losses. It’s crucial to acknowledge these limitations to become a more informed and successful trader.
- Lagging Indicator: MACD is a lagging indicator, meaning it confirms trends rather than predicting them. This means buy/sell signals often appear after a price movement has already begun, potentially leading to missed entry points or delayed exits.
- False Signals: Market noise can easily generate false signals, leading to inaccurate trading decisions. These signals can appear as whipsaws, where the price fluctuates rapidly around a support or resistance level, triggering multiple buy and sell signals in quick succession.
- Inability to Predict Magnitude of Price Movements: MACD only indicates the direction of the trend, not its strength or duration. A strong MACD signal doesn’t necessarily guarantee a large price movement, and a weak signal doesn’t automatically mean a small movement.
- Requires Confirmation: MACD signals should ideally be confirmed by other technical indicators or price action analysis before taking a trade. Relying solely on a MACD crossover can expose you to unnecessary risk.
Impact of Market Noise and False Signals
Forex markets are notoriously volatile, susceptible to sudden price swings driven by news events, economic data releases, and market sentiment. This volatility can generate numerous false MACD signals, especially in ranging markets. Understanding how to identify and avoid these signals is vital for minimizing losses.
For example, consider a scenario where a currency pair is consolidating within a tight range. Small price fluctuations can trigger multiple crossovers of the MACD lines, generating buy and sell signals that quickly reverse. A trader solely relying on these signals would likely experience a series of losing trades, accumulating losses due to frequent entries and exits.
Another example could be a false breakout. A strong upward movement might trigger a bullish MACD signal, but if the price fails to sustain this momentum and quickly retraces, the signal becomes a false positive, leading to a loss for those who entered long positions.
Enhance your insight with the methods and methods of Swing Trading Strategies for Forex.
Risk Management Strategies for MACD Trading
Effective risk management is paramount when using MACD or any technical indicator in Forex trading. Implementing these strategies can significantly reduce the potential for substantial losses.
- Position Sizing: Never risk more than a small percentage (e.g., 1-2%) of your trading capital on any single trade. This limits potential losses even if a trade goes against you.
- Stop-Loss Orders: Always use stop-loss orders to automatically exit a trade if the price moves against your position by a predetermined amount. This protects your capital from significant drawdowns.
- Take-Profit Orders: Set take-profit orders to secure profits when your trading target is reached. This helps to lock in gains and avoid giving them back.
- Diversification: Don’t put all your eggs in one basket. Diversify your trading across different currency pairs and strategies to reduce overall risk.
- Backtesting: Before implementing any MACD-based trading strategy, thoroughly backtest it using historical data to evaluate its performance and identify potential weaknesses.
Practical Application and Examples of MACD in Forex Trading
Understanding the theoretical aspects of the Moving Average Convergence Divergence (MACD) indicator is crucial, but true mastery comes from applying it in real-world forex trading scenarios. This section delves into practical examples, showcasing both successful and unsuccessful trades to illustrate the nuances of using MACD effectively.
Hypothetical Trading Scenarios Using MACD
The following table presents several hypothetical trading scenarios using MACD, demonstrating both profitable and unprofitable outcomes. Remember that these are simplified examples and real-world trading involves many more factors. This illustrates the importance of risk management and not relying solely on one indicator.
| Date | Trade Type | Entry Price (USD/JPY) | Exit Price (USD/JPY) | Profit/Loss (Pips) |
|---|---|---|---|---|
| 2024-03-05 | Buy | 135.00 | 135.50 | 50 |
| 2024-03-08 | Sell | 136.20 | 135.80 | 40 |
| 2024-03-12 | Buy | 135.70 | 135.30 | -40 |
| 2024-03-15 | Sell | 136.00 | 135.50 | 50 |
Real-World Trading Example: A Successful MACD Signal
Let’s consider a real-world example of a successful EUR/USD trade guided by the MACD. Imagine the EUR/USD pair was trading sideways for several days. The MACD line was below the signal line, indicating a bearish trend. Then, the MACD line crossed above the signal line, forming a bullish crossover. This crossover was accompanied by an increase in trading volume. Concurrently, the price action on the candlestick chart showed a clear upward trend. A trader, observing this confluence of signals, entered a long position at 1.1000. The price subsequently rose to 1.1050, allowing the trader to exit the position with a profit of 50 pips. The chart would visually display a clear upward trend in the price action mirroring the bullish MACD crossover; the MACD lines would show a clear transition from below the signal line to above, confirming the buy signal. The increased volume would be visible as taller candlestick bodies during the price increase.
Backtesting a MACD Trading Strategy
Backtesting is crucial for validating any trading strategy, including those based on MACD. This involves testing your strategy on historical data to assess its performance and identify potential weaknesses. The process involves: 1) Defining your trading rules: Specify the exact parameters for your MACD (e.g., fast and slow moving average periods), entry and exit signals, and risk management rules. 2) Gathering historical data: Obtain reliable historical forex data for the currency pair(s) you intend to trade. 3) Simulating trades: Apply your trading rules to the historical data, recording each simulated trade’s entry and exit points, and calculating the profit or loss. 4) Analyzing results: Evaluate the strategy’s performance using metrics like win rate, average profit/loss, maximum drawdown, and Sharpe ratio. This helps refine your strategy and optimize its parameters for better performance. Thorough backtesting significantly reduces the risk of implementing a flawed strategy in live trading.
Conclusive Thoughts: How To Use Moving Average Convergence Divergence (MACD) In Forex
Mastering the Moving Average Convergence Divergence (MACD) indicator in forex trading is a journey, not a destination. By understanding its core components, identifying reliable signals, and incorporating effective risk management, you can significantly enhance your trading strategy. Remember, consistent practice, backtesting, and adapting to market conditions are key to success. While MACD provides valuable insights, it’s crucial to use it in conjunction with other indicators and sound risk management practices for optimal results. So, start charting your path to forex success!
Q&A
What are the common mistakes traders make when using MACD?
Over-reliance on MACD alone, ignoring price action, misinterpreting divergences, and poor risk management are common pitfalls.
Can MACD predict market tops and bottoms?
No, MACD is a lagging indicator, meaning it confirms trends rather than predicting them. It’s best used to identify potential entry and exit points within established trends.
How often should I adjust the MACD settings (fast/slow EMA)?
The default settings (12, 26, 9) often work well, but you can adjust them based on market volatility and your trading style. Backtesting different settings is recommended.
Is MACD suitable for all timeframes?
Yes, MACD can be applied to various timeframes (e.g., 15-minute, hourly, daily), but the interpretation of signals might vary depending on the timeframe.


