How to Trade Forex Using the Trend Following Strategy? It sounds complex, right? But riding the waves of the forex market doesn’t have to be a gamble. This guide breaks down how to harness the power of trends to potentially boost your trading game. We’ll explore everything from identifying those juicy trends using moving averages and candlestick patterns to developing a rock-solid trading plan that protects your profits and limits your losses. Get ready to learn the secrets of successful trend following!
We’ll cover the nitty-gritty details, from understanding different types of trends and choosing the right indicators (think RSI and MACD) to mastering risk management and navigating the emotional rollercoaster of trading. We’ll even dive into advanced techniques like Fibonacci retracements and backtesting your strategy to fine-tune it for maximum impact. By the end, you’ll have a solid foundation to confidently navigate the forex market and potentially turn those trends into serious gains.
Introduction to Trend Following in Forex
Trend following, in the forex market, is a trading strategy that capitalizes on the persistent movement of currency pairs in a specific direction. It’s based on the simple yet powerful idea that trends tend to continue until proven otherwise. Instead of trying to predict market tops and bottoms, trend followers aim to identify established trends and ride them for as long as possible, aiming to profit from the momentum. This approach contrasts sharply with strategies that focus on short-term price fluctuations or reversals.
Core Principles of Trend Following in Forex
Trend following rests on several key principles. First, it emphasizes identifying a clear trend using various technical indicators and price action analysis. This involves confirming the trend’s direction and strength before entering a trade. Second, it utilizes risk management techniques to protect capital, including stop-loss orders to limit potential losses. Third, it focuses on patience, recognizing that identifying strong trends takes time and that not every trade will be a winner. Finally, it emphasizes consistency in applying the trading plan, avoiding emotional decision-making driven by fear or greed. Successful trend following requires discipline and a long-term perspective.
Advantages and Disadvantages of Trend Following
Trend following offers several advantages. It’s relatively easy to understand and implement, requiring less complex market analysis compared to some other strategies. It also suits traders who prefer a less hands-on approach, as trades can be held for extended periods. However, drawbacks exist. The strategy can lead to missed opportunities during periods of sideways or ranging markets, resulting in prolonged periods without profitable trades. Additionally, significant losses can occur if a trend reverses unexpectedly or if a trader fails to properly manage risk. The success of trend following also hinges on accurately identifying the trend’s start and end.
Types of Trends in Forex
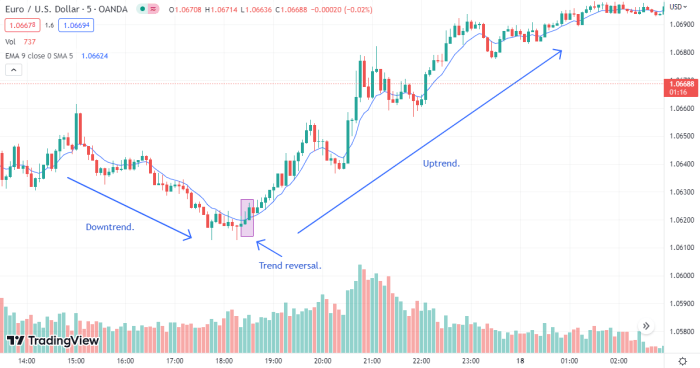
Trends in forex, like other markets, manifest in three primary forms. Uptrends show a consistent upward movement in price, indicated by higher highs and higher lows. Downtrends display a consistent downward movement, characterized by lower highs and lower lows. Sideways or ranging trends lack a clear directional bias, fluctuating within a defined price range. Identifying the type of trend is crucial for selecting appropriate trading strategies; trend following is most effective during clear uptrends or downtrends. For example, the EUR/USD pair experienced a strong uptrend in the latter half of 2021, while the GBP/USD exhibited a significant downtrend during the early months of 2023. These trends presented opportunities for trend-following strategies.
Trend Identification Methods, How to Trade Forex Using the Trend Following Strategy
Choosing the right method for identifying trends is paramount for success. Several methods exist, each with its strengths and weaknesses.
| Method | Description | Advantages | Disadvantages |
|---|---|---|---|
| Moving Averages | Uses average price over a specific period to smooth out price fluctuations and identify trends. Different moving averages (e.g., 20-day, 50-day, 200-day) can be used for different timeframes. | Simple to understand and implement; provides clear signals. | Can lag behind actual price movements; susceptible to whipsaws (false signals) in sideways markets. |
| Relative Strength Index (RSI) | A momentum oscillator that measures the speed and change of price movements. Readings above 70 often suggest overbought conditions, while readings below 30 suggest oversold conditions. | Helps identify potential trend reversals; can be used in conjunction with other indicators. | Can generate false signals; its interpretation requires experience. |
| Support and Resistance Levels | Identifies price levels where the price has historically struggled to break through. Breaks above resistance suggest upward momentum, while breaks below support suggest downward momentum. | Provides clear entry and exit points; relatively simple to identify on charts. | Can be subjective; not always reliable in volatile markets. |
| MACD (Moving Average Convergence Divergence) | Compares two moving averages to identify changes in momentum. Crossovers of the MACD line above the signal line often suggest upward momentum, while crossovers below suggest downward momentum. | Identifies changes in momentum; can confirm trends identified by other indicators. | Can generate false signals; requires understanding of its components. |
Identifying Forex Market Trends
Spotting trends in the forex market is like being a detective—you need to gather clues from various sources to build a convincing case. Ignoring trends is like walking blindly into a crowded room; you’re likely to bump into something unpleasant. Mastering trend identification gives you the edge to navigate the volatile forex world with more confidence.
Moving Averages for Trend Identification
Moving averages smooth out price fluctuations, making it easier to see the underlying trend. They work by calculating the average price over a specific period. Different types of moving averages offer varying levels of responsiveness to price changes. A longer period average will be smoother and slower to react, while a shorter period average will be more responsive but also more prone to noise.
- Simple Moving Average (SMA): This is the most basic type, calculating the average closing price over a defined number of periods. For example, a 20-day SMA averages the closing prices of the last 20 days.
- Exponential Moving Average (EMA): This gives more weight to recent prices, making it more responsive to recent changes than the SMA. A 20-day EMA will react faster to price shifts than a 20-day SMA.
- Weighted Moving Average (WMA): This assigns different weights to prices within the period, usually giving more weight to recent prices. The exact weighting scheme varies depending on the implementation.
When using moving averages, a rising SMA or EMA suggests an uptrend, while a falling one suggests a downtrend. A crossing of two moving averages (e.g., a short-term MA crossing above a long-term MA) can signal a potential trend change. For instance, a 50-day SMA crossing above a 200-day SMA is often seen as a bullish signal.
Candlestick Patterns for Trend Confirmation
Candlestick patterns provide visual clues about the market’s sentiment and can help confirm trends identified by moving averages. These patterns reflect the opening, closing, high, and low prices of a period, revealing the battle between buyers and sellers.
- Bullish Patterns (suggesting upward trend continuation): Examples include the Hammer, Morning Star, and engulfing patterns. A hammer, for example, shows a significant drop in price followed by a strong close near the high, suggesting buyer strength.
- Bearish Patterns (suggesting downward trend continuation): Examples include the Hanging Man, Evening Star, and engulfing patterns. A hanging man resembles a hammer but appears at the top of an uptrend, suggesting a potential reversal.
It’s important to note that candlestick patterns are most effective when used in conjunction with other indicators and analysis techniques. Isolated patterns should be treated with caution.
Support and Resistance Levels in Trend Identification
Support and resistance levels represent price areas where buying and selling pressure is strong. Support levels act as a floor, preventing prices from falling further, while resistance levels act as a ceiling, preventing prices from rising further. A break above resistance confirms an uptrend, while a break below support confirms a downtrend. These levels are dynamic and can shift over time. For example, a previous high might become support after a price pullback.
Using RSI and MACD for Trend Identification
The Relative Strength Index (RSI) and Moving Average Convergence Divergence (MACD) are momentum indicators that can help identify trends and potential trend reversals.
- RSI: This oscillates between 0 and 100. Readings above 70 are generally considered overbought, suggesting a potential downtrend, while readings below 30 are considered oversold, suggesting a potential uptrend. Divergence between price and RSI can also be a valuable signal.
- MACD: This consists of two moving averages and a signal line. A bullish crossover (the fast MA crossing above the slow MA) suggests a potential uptrend, while a bearish crossover suggests a potential downtrend. The histogram of the MACD also provides insights into momentum.
Remember, these indicators are tools, not crystal balls. Use them in conjunction with other analysis methods for a more robust trading strategy. For instance, a bullish MACD crossover confirmed by a break above resistance and a rising 20-day EMA paints a more compelling picture of an uptrend.
Developing a Trend Following Trading Plan
A robust trading plan is your roadmap to success in forex trading, especially when employing a trend-following strategy. It’s not just about identifying trends; it’s about systematically managing risk and capitalizing on those trends with discipline and precision. Without a well-defined plan, even the most accurate trend predictions can lead to losses. This section Artikels the crucial components of a comprehensive trend-following forex trading plan.
Forex Trading Plan Template
A successful forex trading plan should be personalized to your risk tolerance, trading style, and available capital. However, a solid template will include the following key elements:
- Trading Goals: Clearly define your objectives. Are you aiming for long-term growth, consistent income, or short-term gains? Specify your target profit percentage and acceptable drawdown percentage.
- Market Analysis Methodology: Detail your approach to identifying trends. This might involve using moving averages, candlestick patterns, indicators like RSI or MACD, or a combination of techniques. Explain your criteria for confirming a trend.
- Entry Strategy: Describe your rules for entering a trade. This includes specifying the exact entry point based on your chosen indicators and confirming signals. Will you use pending orders or market orders?
- Exit Strategy: Define your rules for exiting a trade, both for profitable and losing trades. This might involve setting take-profit levels based on risk/reward ratios, using trailing stops to lock in profits, or employing stop-loss orders to limit potential losses.
- Position Sizing: Artikel your method for determining the appropriate trade size for each position, considering your account balance and risk tolerance. This will be discussed in more detail below.
- Money Management: Detail your overall capital management strategy. This includes how much capital you’re willing to risk on any single trade, and your overall risk tolerance. Consider techniques like fixed fractional position sizing.
- Risk Management: Define your risk management rules, including stop-loss orders and maximum drawdown limits. This section is crucial for protecting your capital.
- Trading Journal: Describe your process for keeping a detailed trading journal, recording every trade, its outcome, and any lessons learned. This helps to track performance and refine your strategy over time.
Position Sizing and Risk Management
Effective position sizing is paramount in forex trading. It’s about determining the appropriate amount of capital to allocate to each trade, minimizing risk while maximizing potential profits. A common method is to use a fixed percentage of your account balance for each trade.
For example, a trader with a $10,000 account and a 2% risk tolerance per trade would risk a maximum of $200 on any single trade ($10,000 x 0.02 = $200). This risk amount is then used to calculate the position size based on the stop-loss level.
Let’s say the stop-loss is set at 50 pips. To calculate the position size, we need to know the pip value for the currency pair. If the pip value is $1 per pip, the position size would be 200 pips ($200 risk / $1 per pip = 200 units). If the pip value is $10 per pip, the position size would be 20 units ($200 risk / $10 per pip = 20 units).
This calculation ensures that even if the trade goes against the trader, the maximum loss remains within the defined risk tolerance. Remember, this is just an example; the actual position size will vary based on the specific currency pair, leverage used, and the stop-loss level.
Pre-Trade Checklist
Before executing any trend-following trade, a comprehensive checklist is essential to ensure all aspects of the plan are followed:
- Trend Confirmation: Verify the presence of a clear and established trend using your chosen indicators and analysis techniques.
- Entry Point Identification: Pinpoint the precise entry point based on your predefined strategy.
- Stop-Loss Order Placement: Set a stop-loss order to limit potential losses to a predetermined level.
- Take-Profit Order Placement (Optional): Set a take-profit order to lock in profits at a predetermined level, if using a target-based exit strategy.
- Position Size Calculation: Calculate the appropriate position size based on your risk tolerance and account balance.
- Review Trading Plan: Re-examine your trading plan to ensure consistency with your strategy and risk management rules.
- Journal Entry: Record all relevant details of the trade in your trading journal before executing the trade.
Implementing Trend Following Strategies
Successfully navigating the forex market using trend following requires a robust understanding of entry and exit points, risk management, and order placement. This section delves into the practical application of these strategies, focusing on maximizing profits while mitigating potential losses. Remember, consistent profitability in forex trading is a marathon, not a sprint, and discipline is key.
Entry and Exit Strategies for Long and Short Positions
Trend following, at its core, involves identifying a prevailing trend and capitalizing on its continuation. For long positions (betting on price increases), entry signals often involve confirmation of an uptrend through indicators like moving averages or breakouts above resistance levels. Conversely, short positions (betting on price decreases) require confirmation of a downtrend, often marked by a breakdown below support levels or bearish candlestick patterns. Exit strategies should be pre-defined and tied to your trading plan. This could involve trailing stops, target price levels, or a reversal in trend signals. For example, a long position might be exited if the price falls below a crucial support level or a key moving average, while a short position might be closed if the price breaks above resistance.
Trailing Stops to Protect Profits
Trailing stops are dynamic stop-loss orders that adjust as the price moves favorably. They are designed to lock in profits while minimizing potential losses. Imagine you’ve entered a long position and the price is steadily rising. A trailing stop, set at a percentage below the current price (e.g., 2%), will automatically move upwards as the price increases, securing your gains. If the price reverses sharply, the trailing stop will trigger, limiting your losses to a predetermined level. For instance, if you bought EUR/USD at 1.1000 and set a 2% trailing stop, the stop-loss order would initially be at 1.0780 (1.1000 – 0.0220). As the price rises to 1.1200, the trailing stop would adjust to 1.0976 (1.1200 – 0.0224). This dynamic adjustment protects profits while allowing the trade to ride the trend.
Stop-Loss Orders to Limit Potential Losses
Stop-loss orders are crucial for risk management. They automatically close a position when the price reaches a predetermined level, preventing further losses. These orders are essential for protecting capital and ensuring you don’t experience devastating losses due to unexpected market swings. The placement of a stop-loss order should be strategic, considering factors like volatility and support/resistance levels. A poorly placed stop-loss can be triggered prematurely, cutting short profitable trades, while a stop-loss placed too far away can lead to significant losses if the market moves against you. For example, a trader might set a stop-loss order at 1% below their entry price, limiting potential losses to 1% of their invested capital.
Risk Management Techniques for Trend Following
Effective risk management is paramount in forex trading. Trend following strategies often involve holding positions for extended periods, making risk management even more crucial. Several techniques can be employed. Position sizing, for instance, involves determining the appropriate amount of capital to allocate to each trade, limiting exposure to any single position. Diversification across multiple currency pairs can also reduce overall risk. Furthermore, utilizing a fixed fractional position sizing approach (e.g., risking only 1-2% of your account on any given trade) ensures that a single losing trade won’t significantly impact your overall trading capital. Regularly reviewing your trading performance and adjusting your risk management strategy based on market conditions is essential for long-term success.
Managing Risk and Emotions in Trend Following: How To Trade Forex Using The Trend Following Strategy
Trend following, while potentially lucrative, is a rollercoaster ride. Success hinges not just on identifying trends but also on mastering the psychological aspects of trading and effectively managing risk. Ignoring these crucial elements can lead to devastating losses, even with the most sophisticated trading strategies. This section explores the emotional challenges of forex trading and provides practical strategies to navigate them.
Psychological Aspects of Forex Trading and Emotional Management
Forex trading is a mentally demanding activity. Fear, greed, and hope—powerful emotions—can cloud judgment and lead to impulsive decisions. Fear of loss can cause traders to exit profitable positions prematurely, while greed can lead to holding onto losing trades for too long, hoping for a reversal. The hope for quick riches often fuels unrealistic expectations and impatience, leading to poor risk management. Effective emotional management involves self-awareness, discipline, and a commitment to sticking to a well-defined trading plan. Developing a calm and objective mindset is paramount. Techniques like mindfulness and meditation can help traders center themselves and make rational decisions, even under pressure.
Strategies for Avoiding Emotional Trading Decisions
Several strategies can help traders avoid making emotional trading decisions. One crucial technique is to establish clear entry and exit rules based on technical indicators and price action, rather than gut feelings. Sticking to a pre-determined plan reduces the influence of emotions on trading decisions. Another effective method is maintaining a trading journal. Regularly recording trades, including rationale, emotions felt during the trade, and the outcome, helps identify emotional biases and patterns of behavior. This self-reflection process promotes continuous improvement and emotional regulation. Furthermore, setting realistic profit targets and stop-loss orders helps control risk and prevents overexposure to potential losses, reducing the likelihood of panic-driven decisions.
Handling Winning and Losing Trades
A consistent approach to both winning and losing trades is crucial for long-term success. Winning trades should be celebrated, but not allowed to inflate ego or encourage overconfidence. The focus should remain on adhering to the trading plan, not on the size of the profit. Losing trades, on the other hand, should be analyzed objectively to identify potential areas for improvement, without letting them fuel self-doubt or lead to revenge trading. A detailed post-trade analysis, including identifying potential mistakes, helps refine the trading strategy and prevent repeating past errors. Maintaining a disciplined approach regardless of the outcome is key to maintaining a consistent performance.
Common Trading Mistakes to Avoid
Many traders fall prey to common mistakes that can severely impact their profitability. One significant error is overtrading. Taking too many trades increases the probability of encountering losses, and can lead to emotional exhaustion. Another common mistake is neglecting risk management. Failing to set stop-loss orders or over-leveraging can lead to substantial losses that wipe out trading accounts. Ignoring market conditions and trading without a clear plan are also frequent pitfalls. Finally, revenge trading, driven by emotions after a loss, is a particularly dangerous habit that often leads to further losses. By understanding these common mistakes and proactively avoiding them, traders can significantly improve their trading performance and reduce their risk.
Backtesting and Optimizing Your Strategy
Backtesting is crucial for any forex trading strategy, especially a trend-following one. It allows you to rigorously test your approach using historical data, identifying potential flaws and refining your parameters before risking real capital. Without backtesting, you’re essentially gambling, hoping your strategy works in live markets. This section will guide you through the process, ensuring your trend-following strategy is robust and profitable.
The Importance of Backtesting
Backtesting involves simulating your trading strategy on historical forex data. This process helps you evaluate its performance under various market conditions, including periods of high volatility and prolonged trends. By analyzing past results, you can identify potential weaknesses, assess the effectiveness of your risk management techniques, and fine-tune your trading parameters for optimal performance. Essentially, it’s a virtual trial run that helps you avoid costly mistakes in live trading. A well-backtested strategy significantly increases your chances of success in the real forex market.
Backtesting a Trend-Following Strategy
Backtesting a trend-following strategy requires historical forex data, preferably covering a period of several years to capture diverse market conditions. You’ll also need a platform or software capable of executing your trading rules automatically on this data. Here’s a step-by-step guide:
1. Gather Historical Data: Obtain reliable historical forex data, including open, high, low, and close (OHLC) prices, for your chosen currency pairs. Many brokers provide historical data, or you can utilize specialized data providers.
2. Define Your Trading Rules: Clearly define your trend-following strategy’s entry and exit rules, including indicators (e.g., moving averages, MACD), stop-loss levels, and take-profit targets. The more precise your rules, the more accurate your backtest will be.
3. Automate the Backtest: Use trading software or a programming language (like Python with libraries like pandas and backtrader) to automate the backtesting process. This eliminates manual calculations and potential errors, allowing you to test a wide range of parameters efficiently.
4. Analyze the Results: Evaluate the backtest results carefully. Key metrics include win rate (percentage of winning trades), average profit per trade, average loss per trade, maximum drawdown (largest peak-to-trough decline in equity), and overall profitability.
Optimizing Trading Parameters
Once you’ve completed an initial backtest, you can optimize your trading parameters to enhance performance. This involves systematically adjusting variables such as the period of your moving averages, stop-loss and take-profit levels, and the indicator thresholds used to generate trading signals. The goal is to find the optimal combination that maximizes profitability while minimizing risk. Remember that over-optimization, where you fit your strategy too closely to the historical data, can lead to poor performance in live trading.
Backtesting Results: Example
The following table shows the results of backtesting a simple moving average crossover strategy with different parameter settings on the EUR/USD pair over a five-year period. Note that these are hypothetical results and actual performance may vary.
| Parameter | Setting | Win Rate | Average Profit/Loss |
|---|---|---|---|
| Fast MA Period | 10 | 55% | $120 |
| Fast MA Period | 20 | 60% | $100 |
| Slow MA Period | 50 | 50% | $150 |
| Slow MA Period | 100 | 45% | $200 |
Advanced Trend Following Techniques
Level up your forex trading game by mastering advanced techniques that can significantly enhance your trend-following strategy. This section delves into sophisticated tools and methods to refine your approach and potentially improve your profitability. We’ll explore how to leverage these tools to identify high-probability trades and manage risk more effectively.
Fibonacci Retracements and Extensions in Trend Following
Fibonacci retracements and extensions are powerful tools derived from the Fibonacci sequence, a mathematical sequence found throughout nature. In forex trading, these tools help identify potential support and resistance levels within a trending market. Retracements measure the percentage pullbacks within a trend, while extensions project potential price targets after a retracement. Traders often use the 23.6%, 38.2%, 50%, 61.8%, and 78.6% retracement levels as key support or resistance areas. For extensions, the 127.2%, 161.8%, and 261.8% levels are commonly used to anticipate potential price targets. For example, if EUR/USD experiences a significant uptrend, a retracement to the 38.2% Fibonacci level might present a buying opportunity, with a potential target at the 161.8% Fibonacci extension level. Successful application requires careful consideration of the overall market context and other technical indicators.
Advanced Indicators for Trend Following
Beyond simple moving averages, several advanced indicators can refine trend identification and timing. The Average Directional Index (ADX) measures the strength of a trend, while the Relative Strength Index (RSI) helps identify overbought and oversold conditions, potentially signaling trend reversals or continuation. The Moving Average Convergence Divergence (MACD) indicator identifies momentum changes and potential trend shifts. Combining these indicators with price action analysis can provide a more comprehensive view of the market, leading to more informed trading decisions. For instance, a strong uptrend confirmed by a high ADX reading, coupled with an RSI above 50 but not in overbought territory, suggests a continuation of the uptrend.
Comparison of Trend-Following Systems
Breakout systems and channel trading represent two distinct approaches to trend following. Breakout systems focus on identifying price breakouts from established ranges or consolidation patterns, signaling a potential new trend. Channel trading, on the other hand, involves identifying price channels and trading within those boundaries, exploiting price movements within the established trend. Breakout systems tend to be more aggressive, aiming for larger potential profits but also carrying higher risk. Channel trading is often considered a more conservative approach, aiming for smaller, more consistent profits. The choice between these systems depends on individual risk tolerance and trading style. For example, a trader with a higher risk tolerance might prefer a breakout system, while a more conservative trader might opt for channel trading.
Incorporating News Events and Economic Data
News events and economic data releases can significantly impact forex markets. Trend followers can incorporate this information by adjusting their strategies based on anticipated market reactions. For example, a positive economic report might strengthen a bullish trend, while negative news could trigger a pullback or even a trend reversal. However, it’s crucial to differentiate between market noise and significant events that genuinely shift the underlying trend. Sophisticated trend followers often use fundamental analysis alongside technical analysis to assess the impact of news events on their trading strategies. A strong uptrend in GBP/USD, for instance, might be further fueled by positive UK economic data, potentially extending the uptrend. Conversely, unexpectedly weak data could lead to a retracement or even a reversal.
Final Conclusion
Mastering the art of trend following in forex trading isn’t about getting rich quick; it’s about building a sustainable strategy based on understanding market dynamics and disciplined risk management. This guide has armed you with the knowledge to identify trends, develop a robust trading plan, and manage your emotions effectively. Remember, consistent learning and practice are key. So, buckle up, refine your strategy, and prepare to navigate the exciting world of forex trading with confidence. The potential rewards are substantial, but responsible trading is paramount.
FAQ Corner
What’s the difference between a simple moving average and an exponential moving average?
A simple moving average (SMA) averages the price over a set period, while an exponential moving average (EMA) gives more weight to recent prices, making it more responsive to current trends.
How often should I check my trades?
This depends on your strategy and risk tolerance. Some traders check constantly, others only at the end of the day or week. Over-monitoring can lead to emotional decisions.
Can I use trend following in all market conditions?
Trend following works best in trending markets. Sideways or ranging markets can lead to frequent losses. Consider alternative strategies for non-trending conditions.
What are some common mistakes to avoid?
Overtrading, ignoring stop-losses, revenge trading after losses, and letting emotions drive decisions are all common pitfalls.
Enhance your insight with the methods and methods of The Best Forex Trading Courses in 2025.
Find out further about the benefits of The Importance of Risk Management in Forex Trading that can provide significant benefits.


