Forex trading tools are your secret weapons in the thrilling world of currency exchange. From charting software that deciphers market whispers to automated systems executing trades with lightning speed, the right tools can transform your trading game. This guide dives deep into the diverse landscape of forex trading tools, exploring everything from technical indicators to fundamental analysis techniques and risk management strategies. Whether you’re a seasoned trader or just starting your journey, get ready to unlock the power of these essential tools.
We’ll break down the different types of tools, comparing and contrasting their features and benefits. You’ll learn how to interpret charts, utilize indicators like moving averages and RSI, and even build your own automated trading strategies. We’ll also address the crucial aspects of risk management, ensuring you navigate the forex market with confidence and control. Prepare to equip yourself with the knowledge and tools needed to conquer the forex world.
Types of Forex Trading Tools
Navigating the forex market successfully requires the right tools. From charting software to economic indicators, a diverse toolkit can significantly enhance your trading strategy and potentially improve your results. Understanding the different types of tools available is crucial for any trader, regardless of experience level. This section breaks down the key categories of forex trading tools and highlights their strengths and weaknesses.
Categorization of Forex Trading Tools
Forex trading tools can be broadly categorized into several groups based on their primary function. Choosing the right tools depends heavily on your trading style, risk tolerance, and overall strategy.
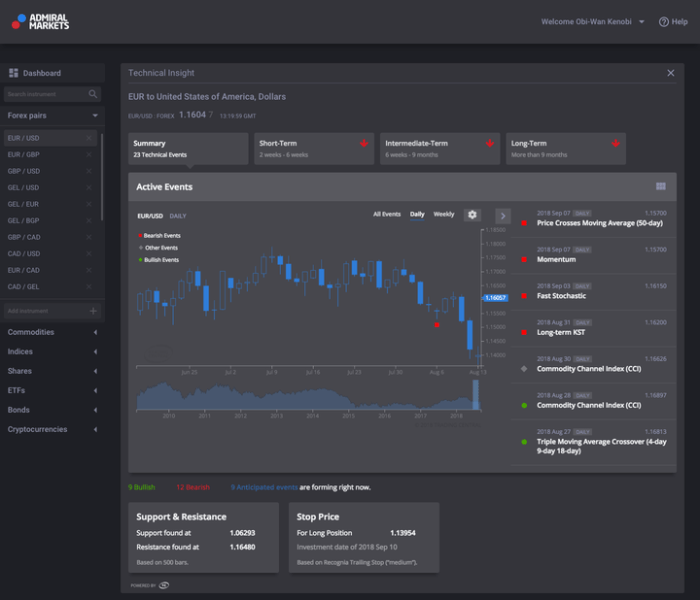
- Charting and Technical Analysis Tools: These tools allow traders to visually analyze price movements and identify patterns using various indicators (like moving averages, RSI, MACD) and chart types (candlestick, bar, line). Examples include TradingView, MetaTrader 4’s charting capabilities, and custom-built indicators within trading platforms.
- Fundamental Analysis Tools: These tools provide economic data and news impacting currency values. Examples include economic calendars (forex factory, investing.com), news aggregators, and specialized software that analyzes economic reports and central bank statements.
- Automated Trading Tools (Expert Advisors or EAs): These are pre-programmed algorithms that execute trades automatically based on predefined rules. Examples include various EAs available on platforms like MetaTrader 4 and 5, although their effectiveness varies widely.
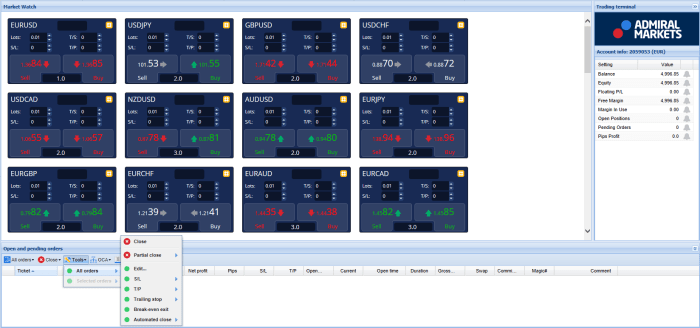
- Order Management Tools: These tools help traders manage their open positions, set stop-loss and take-profit orders, and track their overall portfolio performance. Most trading platforms include built-in order management features, but some third-party tools offer more advanced functionalities.
- Risk Management Tools: These tools assist in calculating position sizing, setting stop-loss orders, and managing overall risk exposure. Examples include position size calculators available online and integrated risk management features within many trading platforms.
Technical Analysis Tools versus Fundamental Analysis Tools
Technical analysis tools focus on past price action and chart patterns to predict future price movements. They are data-driven and rely on visual interpretation of charts. Fundamental analysis tools, conversely, analyze macroeconomic factors (interest rates, inflation, political events) to assess the intrinsic value of a currency pair. Technical analysis is short-term focused, while fundamental analysis often informs longer-term trading strategies. Successful traders often combine both approaches for a more comprehensive view.
Automated Trading Tools versus Manual Trading Tools
Automated trading tools (EAs) offer the advantage of executing trades 24/7 without emotional interference, potentially leading to more disciplined trading. However, they require careful programming and testing, and their performance is heavily dependent on market conditions and the quality of the EA itself. Manual trading, on the other hand, allows for greater flexibility and adaptability to changing market dynamics, but it is susceptible to emotional biases and requires constant monitoring.
Comparison of Forex Trading Platforms
The choice of trading platform significantly impacts access to and usability of trading tools. Here’s a comparison of three popular platforms:
| Platform Name | Key Features | Pricing | User Reviews Summary |
|---|---|---|---|
| MetaTrader 4 (MT4) | Extensive charting tools, customizable indicators, automated trading (EAs), large community support. | Generally free, but brokerage fees apply. | Highly rated for its versatility and customizability, but some users find the interface dated. |
| MetaTrader 5 (MT5) | Improved upon MT4 with enhanced charting, more advanced order types, and economic calendar integration. | Generally free, but brokerage fees apply. | Praised for its advanced features, but the learning curve can be steeper than MT4. |
| cTrader | Known for its speed, advanced charting capabilities, and excellent order management tools; strong focus on algorithmic trading. | Generally free, but brokerage fees apply. | Often lauded for its speed and user-friendly interface, particularly appreciated by scalpers and algorithmic traders. |
Indicators and Charting Tools
Navigating the forex market successfully requires more than just gut feeling; it demands a deep understanding of technical analysis tools. These tools, ranging from simple moving averages to complex candlestick patterns, provide valuable insights into market trends and potential trading opportunities. Mastering these tools is crucial for making informed decisions and increasing your chances of profitability.
Moving Averages, RSI, and MACD Indicators
Moving averages, Relative Strength Index (RSI), and Moving Average Convergence Divergence (MACD) are fundamental technical indicators used by forex traders to identify trends and potential reversals. Moving averages smooth out price fluctuations, revealing underlying trends. A simple moving average (SMA) calculates the average price over a specific period, while an exponential moving average (EMA) gives more weight to recent prices. Traders often use multiple moving averages with different timeframes to identify support and resistance levels, as well as potential buy or sell signals based on crossovers. The RSI, ranging from 0 to 100, measures the magnitude of recent price changes to evaluate overbought (above 70) and oversold (below 30) conditions, suggesting potential trend reversals. The MACD, formed by the difference between two exponential moving averages, identifies momentum changes and potential trend shifts. Crossovers of the MACD line above its signal line often signal bullish momentum, while crossovers below suggest bearish momentum.
Candlestick Chart Functionality and Patterns, Forex trading tool
Candlestick charts visually represent price movements over a specific period, providing a rich source of information for traders. Each candlestick represents the open, high, low, and closing prices of a currency pair during that period. Different candlestick patterns, formed by the combination of several candlesticks, offer valuable trading signals. For instance, a bullish engulfing pattern, where a large green candlestick completely engulfs a previous red candlestick, suggests a potential bullish reversal. Conversely, a bearish engulfing pattern signals a potential bearish reversal. Other important patterns include hammers, hanging men, and shooting stars, each providing insights into potential price direction changes. Analyzing these patterns in conjunction with other indicators helps traders make more informed decisions.
Support and Resistance Level Interpretation
Support and resistance levels represent price zones where the market has historically struggled to break through. Support levels mark price floors where buying pressure is strong enough to prevent further declines, while resistance levels mark price ceilings where selling pressure prevents further advances. Consider a hypothetical EUR/USD chart. Suppose the EUR/USD pair repeatedly bounces off the 1.1000 level after several declines, indicating strong buying pressure at that price. This 1.1000 level acts as a support level. If the pair subsequently rises and repeatedly fails to break above 1.1200, this becomes a resistance level, indicating strong selling pressure. A break above the resistance level could signal a bullish trend, while a break below the support level could signal a bearish trend. These levels are dynamic and can shift over time, reflecting changes in market sentiment and underlying conditions.
Popular Charting Tools and Their Key Features
Choosing the right charting tool is essential for effective forex trading. Here are five popular options:
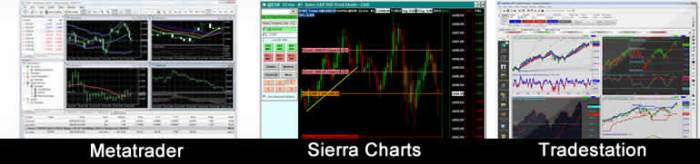
- MetaTrader 4 (MT4): A widely used platform offering advanced charting capabilities, technical indicators, automated trading (Expert Advisors), and a large community of users.
- MetaTrader 5 (MT5): The successor to MT4, featuring improved charting tools, a wider range of indicators, and enhanced order management capabilities.
- TradingView: A popular web-based platform providing advanced charting features, a vast library of technical indicators, social interaction features, and integration with various brokers.
- cTrader: Known for its speed and efficiency, particularly suited for algorithmic and automated trading strategies.
- NinjaTrader: A powerful platform favored by active traders, offering advanced charting tools, backtesting capabilities, and a comprehensive suite of automated trading functionalities.
Automated Trading Systems (Expert Advisors)
Automated trading systems, or Expert Advisors (EAs), are pre-programmed software robots that execute trades based on a defined set of rules. They offer the allure of round-the-clock market monitoring and emotionless execution, a stark contrast to the often-erratic decisions of human traders. However, this technological advantage comes with its own set of risks and rewards.
Risks and Benefits of Using Expert Advisors
EAs can significantly improve trading efficiency by automating repetitive tasks and allowing for simultaneous monitoring of multiple markets. This frees up the trader’s time for other activities or allows them to manage a larger portfolio. However, the potential for substantial losses is a significant risk. A poorly designed or inadequately tested EA can quickly drain an account, especially during periods of high market volatility. Over-reliance on an EA without proper oversight can also lead to missed opportunities or the inability to react to unforeseen market events. The benefits lie in the potential for increased profitability and efficiency, while the risks stem from the potential for significant losses due to unforeseen market events or EA malfunctions. A thorough understanding of both is crucial before deploying an EA.
Backtesting and Optimizing an Expert Advisor
Backtesting involves running an EA on historical market data to evaluate its performance under past conditions. This process allows traders to assess the EA’s profitability, risk exposure, and drawdown potential before deploying it with real funds. Optimization involves fine-tuning the EA’s parameters to improve its performance based on the backtesting results. This is an iterative process, requiring adjustments to variables like stop-loss levels, take-profit targets, and entry/exit signals. It’s crucial to remember that backtested results do not guarantee future performance, as market conditions are constantly changing. However, robust backtesting and optimization significantly reduce the risk of deploying a poorly performing EA. A common approach involves testing on multiple datasets and timeframes to gauge robustness.
Examples of Trading Strategies Implemented with Expert Advisors
Several distinct trading strategies can be implemented using EAs. Here are three examples:
- Trend Following: This strategy identifies and capitalizes on established market trends. The EA would enter long positions during uptrends and short positions during downtrends, using indicators like moving averages to confirm the trend direction. Stop-loss and take-profit orders would be set to manage risk and secure profits.
- Mean Reversion: This strategy aims to profit from price fluctuations around a central average. The EA would identify overbought or oversold conditions using indicators like RSI or stochastic oscillators, then enter trades expecting a reversal back towards the average. Stop-loss orders would be placed to limit losses if the price continues to move away from the average.
- Scalping: This strategy involves taking advantage of small price movements over short periods. The EA would rapidly enter and exit trades, aiming for small, frequent profits. This requires precise timing and low slippage, making it crucial to have a robust and responsive broker and EA.
Hypothetical Expert Advisor Strategy for High Volatility
This hypothetical EA, named “Volatility Surge Trader,” is designed to capitalize on periods of high volatility in a specific currency pair, for example, EUR/USD.
The core logic revolves around identifying periods of heightened volatility using the Average True Range (ATR) indicator. When the ATR surpasses a pre-defined threshold (e.g., 1.5 times its 20-period average), the EA interprets this as a high-volatility period.
The EA then uses a combination of the Relative Strength Index (RSI) and Bollinger Bands to identify potential entry and exit points. A bullish signal is generated when the RSI crosses above 30 while the price is touching the lower Bollinger Band. A bearish signal is generated when the RSI crosses below 70 while the price is touching the upper Bollinger Band.
Stop-loss orders are set at a fixed percentage of the entry price (e.g., 2%), while take-profit orders are set at a multiple of the ATR (e.g., 1.5 times the current ATR value). This dynamic take-profit level adapts to the changing volatility of the market. The EA would also incorporate a trailing stop-loss to secure profits as the price moves in the favorable direction. The parameters would be adjusted based on backtesting results and ongoing market analysis. This strategy is inherently riskier due to its focus on volatile conditions, requiring careful risk management and rigorous testing.
Fundamental Analysis Tools
Fundamental analysis in forex trading delves into the economic and political factors influencing currency values. Unlike technical analysis, which focuses on price charts, fundamental analysis examines the underlying reasons for currency movements, providing a long-term perspective on market trends. Understanding these fundamentals empowers traders to make informed decisions based on the bigger picture.
Key Economic Indicators Influencing Forex Prices
Three key economic indicators significantly impact forex prices: Gross Domestic Product (GDP), inflation rates, and interest rates. GDP reflects a country’s economic output, with higher GDP growth generally strengthening its currency. Inflation, the rate at which prices rise, erodes purchasing power; high inflation weakens a currency, while low and stable inflation is usually preferred. Interest rates, set by central banks, influence borrowing costs and investment flows. Higher interest rates attract foreign investment, strengthening the currency.
Conducting a Fundamental Analysis of a Currency Pair
A step-by-step procedure for conducting a fundamental analysis of a specific currency pair, say EUR/USD, involves: 1) Assessing the economic health of the Eurozone (using GDP growth, inflation, unemployment data) and the United States (using similar data). 2) Comparing these economic indicators to gauge relative strength. 3) Analyzing central bank policies of the European Central Bank (ECB) and the Federal Reserve (Fed), focusing on interest rate decisions and monetary policy statements. 4) Considering geopolitical events impacting either region (e.g., political instability, trade disputes). 5) Integrating this information to predict the likely direction of the EUR/USD exchange rate. This holistic approach allows traders to anticipate shifts in currency values.
News Sources and Economic Calendars for Forex Trading
News sources and economic calendars offer complementary information for forex trading. News sources provide real-time updates on events affecting currency markets, offering context and narrative around economic data. Economic calendars, on the other hand, offer a structured overview of upcoming economic announcements, allowing traders to anticipate potential market volatility. While news sources offer qualitative insights, economic calendars provide quantitative data points. Combining both provides a more comprehensive understanding of market dynamics.
Impact of Major Global Events on Currency Pairs
| Event Type | Currency Pair | Impact | Example |
|---|---|---|---|
| Interest Rate Hike | USD/JPY | USD strengthens | The Federal Reserve raises interest rates, attracting investment into US dollar assets, increasing demand for USD and strengthening it against the JPY. |
| Political Instability | GBP/USD | GBP weakens | Political uncertainty in the UK leads to capital flight, reducing demand for the British pound and weakening it against the US dollar. |
| Unexpected Economic Data | EUR/USD | EUR strengthens or weakens | Stronger-than-expected Eurozone GDP growth may boost the Euro against the US dollar; conversely, weaker-than-expected data would weaken the Euro. |
| Trade War Escalation | USD/CNY | USD strengthens or weakens (depending on the specifics) | Escalation of trade tensions between the US and China could lead to increased volatility in the USD/CNY pair, with the direction depending on market sentiment and the specific trade policies implemented. |
Risk Management Tools: Forex Trading Tool
Forex trading, while potentially lucrative, is inherently risky. Ignoring risk management is like sailing a ship without a rudder – you might get lucky, but a storm will likely sink you. Effective risk management isn’t about avoiding losses entirely; it’s about controlling them and ensuring your trading journey remains sustainable. This section dives into essential tools and techniques for navigating the volatile waters of the forex market.
Stop-Loss and Take-Profit Orders
Stop-loss and take-profit orders are fundamental risk management tools. A stop-loss order automatically closes a trade when the price reaches a predetermined level, limiting potential losses. Conversely, a take-profit order automatically closes a trade when the price reaches a predetermined profit target, securing your gains. Imagine you’ve bought EUR/USD at 1.1000. Setting a stop-loss at 1.0950 means your trade will close automatically if the price drops to that level, preventing larger losses. Simultaneously, a take-profit order at 1.1050 would close the trade if the price rises to that level, locking in your profit. The judicious use of these orders is crucial for emotional detachment and disciplined trading.
Position Sizing Based on Risk Tolerance
Determining the appropriate position size is critical for managing risk. Several methods exist, each tailored to different risk appetites. One common approach is to risk a fixed percentage of your trading capital on each trade, say 1% or 2%. For example, with a $10,000 account and a 1% risk tolerance, you wouldn’t risk more than $100 on any single trade. Another method involves calculating position size based on the stop-loss distance. If your stop-loss is 50 pips away, and you’re willing to risk $100, you can determine the appropriate lot size based on your broker’s pip value. Careful calculation here ensures that even unsuccessful trades don’t severely impact your overall capital.
Managing Emotional Biases
Emotional biases, such as fear, greed, and overconfidence, can severely impair trading decisions. Employing techniques like journaling, where you record your trades, rationale, and emotions, can provide valuable insights into your behavioral patterns. Regularly reviewing your journal can help identify and address emotional biases. Another effective strategy is to create a detailed trading plan that Artikels your entry and exit strategies, risk tolerance, and position sizing. Sticking to this plan, regardless of emotional impulses, is vital for consistent performance. Furthermore, taking breaks from trading when feeling overwhelmed or stressed prevents impulsive decisions driven by emotion rather than logic.
Risk Management Techniques
Effective risk management involves a multi-pronged approach. Here are five key techniques to minimize potential losses:
- Diversification: Don’t put all your eggs in one basket. Diversify your portfolio across different currency pairs and trading strategies to reduce the impact of any single losing trade.
- Regular Reviews: Periodically review your trading performance, identifying areas for improvement in your risk management strategy. This allows for adaptation and refinement.
- Backtesting: Before implementing any new strategy, rigorously backtest it using historical data. This helps assess its potential profitability and risk profile in a controlled environment.
- Stop-Loss Orders: As discussed earlier, always use stop-loss orders to limit potential losses on each trade. This is non-negotiable.
- Take-Profit Orders: Set take-profit orders to lock in profits when your trading targets are met. This helps secure gains and avoid letting profits slip away.
Concluding Remarks
Mastering the forex market requires more than just luck; it demands the right tools and a strategic approach. This guide has provided a comprehensive overview of the various forex trading tools available, from technical analysis tools to fundamental analysis tools, and automated trading systems. By understanding the strengths and weaknesses of each tool, and by incorporating effective risk management techniques, you can significantly improve your trading performance and increase your chances of success. Remember, consistent learning and adaptation are key to long-term success in this dynamic market. So, equip yourself, strategize, and trade smart!
Browse the multiple elements of best forex trading courses to gain a more broad understanding.
You also can investigate more thoroughly about simple forex trading strategies to enhance your awareness in the field of simple forex trading strategies.


